75.实时曲线坐标系设计-Arkts
本文介绍了一个实时曲线坐标系的实现方案,具有以下特点:1) 数据管理方面,初始化10个0-100范围的随机数据点,每秒自动更新数据;2) 坐标系设计包含0-9的X轴和0-100的Y轴,带网格线和清晰标签;3) 曲线绘制采用红色连线,配有半透明填充和双层圆点标记;4) 整体采用浅灰背景和专业配色,每秒自动更新显示最新10个数据点。通过ArkTS代码实现了Canvas绘制功能,包括网格、坐标轴、曲线和
·
5.实时曲线坐标系设计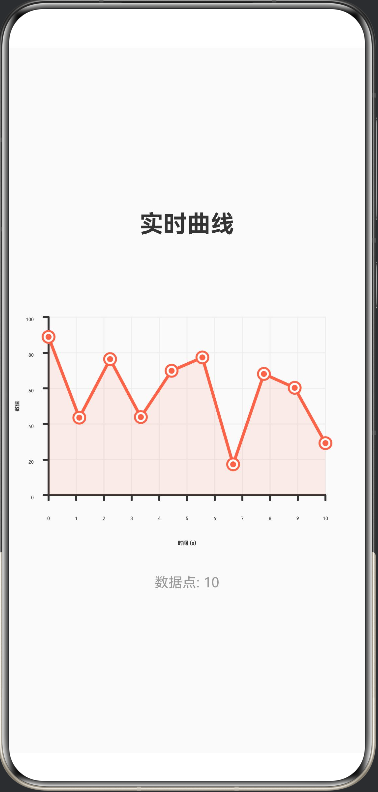
功能特点:
1.数据管理:
初始化10个随机数据点(0-100范围)
每秒自动更新:移除第一个数据,添加新的随机数据
使用 @Watch 监听数据变化,自动重绘曲线
2.坐标系设计:
X轴:0-9(10个数据点)
Y轴:0-100(数值范围)
带网格线(水平和垂直)
坐标轴标签清晰标注
3.曲线绘制:
红色曲线连接所有数据点
曲线下方有半透明填充区域
每个数据点有双层圆点标记(白底红圈+红点)
4.视觉效果:
标题"实时曲线"
底部显示数据点数量
浅灰背景,专业配色
曲线会每秒自动更新,显示最新的10个随机数据点!
@Entry
@Component
struct Index {
  @State data: number[] = []

  aboutToAppear() {
    this.initData()
    this.startDataUpdate()
  }

  initData() {
    this.data = []
    for (let i = 0; i < 10; i++) {
      this.data.push(Math.random() * 100)
    }
  }

  startDataUpdate() {
    setInterval(() => {
      const newData = [...this.data]
      newData.shift()
      newData.push(Math.random() * 100)
      this.data = newData
    }, 1000)
  }

  build() {
    Column({ space: 20 }) {
      Text('实时曲线')
        .fontSize(24)
        .fontWeight(FontWeight.Bold)
        .fontColor('#333333')

      RealTimeCurve({ data: this.data })
        .width(400)
        .height(300)

      Text('数据点: ' + this.data.length)
        .fontSize(14)
        .fontColor('#999999')
    }
    .width('100%')
    .height('100%')
    .justifyContent(FlexAlign.Center)
    .backgroundColor('#FAFAFA')
  }
}

@Component
struct RealTimeCurve {
  @Prop @Watch('onDataChange') data: number[]

  private settings: RenderingContextSettings = new RenderingContextSettings(true)
  private context: CanvasRenderingContext2D = new CanvasRenderingContext2D(this.settings)
  private isReady: boolean = false

  build() {
    Canvas(this.context)
      .width(400)
      .height(300)
      .onReady(() => {
        this.isReady = true
        this.drawCurve()
      })
  }

  onDataChange() {
    if (this.isReady) {
      this.drawCurve()
    }
  }

  drawCurve() {
    const width = 400
    const height = 300
    const padding = 60
    const chartWidth = width - padding * 2
    const chartHeight = height - padding * 2

    // 清空画布
    this.context.clearRect(0, 0, width, height)

    // 绘制背景网格
    this.drawGrid(padding, chartWidth, chartHeight)

    // 绘制坐标轴
    this.drawAxes(padding, chartWidth, chartHeight)

    // 绘制曲线
    this.drawCurveLine(padding, chartWidth, chartHeight)

    // 绘制数据点
    this.drawDataPoints(padding, chartWidth, chartHeight)
  }

  drawGrid(padding: number, chartWidth: number, chartHeight: number) {
    this.context.strokeStyle = '#EEEEEE'
    this.context.lineWidth = 1

    // 水平网格线
    for (let i = 0; i <= 5; i++) {
      const y = padding + (chartHeight / 5) * i
      this.context.beginPath()
      this.context.moveTo(padding, y)
      this.context.lineTo(padding + chartWidth, y)
      this.context.stroke()
    }

    // 垂直网格线
    for (let i = 0; i <= 10; i++) {
      const x = padding + (chartWidth / 10) * i
      this.context.beginPath()
      this.context.moveTo(x, padding)
      this.context.lineTo(x, padding + chartHeight)
      this.context.stroke()
    }
  }

  drawAxes(padding: number, chartWidth: number, chartHeight: number) {
    this.context.strokeStyle = '#333333'
    this.context.lineWidth = 2

    // X轴
    this.context.beginPath()
    this.context.moveTo(padding, padding + chartHeight)
    this.context.lineTo(padding + chartWidth, padding + chartHeight)
    this.context.stroke()

    // Y轴
    this.context.beginPath()
    this.context.moveTo(padding, padding)
    this.context.lineTo(padding, padding + chartHeight)
    this.context.stroke()

    // 绘制刻度标签
    this.context.font = '14px sans-serif'
    this.context.fillStyle = '#333333'
    this.context.textAlign = 'center'

    // X轴刻度
    for (let i = 0; i <= 10; i++) {
      const x = padding + (chartWidth / 10) * i
      this.context.fillText(i.toString(), x, padding + chartHeight + 25)

      // 绘制刻度线
      this.context.beginPath()
      this.context.moveTo(x, padding + chartHeight)
      this.context.lineTo(x, padding + chartHeight + 5)
      this.context.stroke()
    }

    // Y轴刻度
    this.context.textAlign = 'right'
    for (let i = 0; i <= 5; i++) {
      const y = padding + chartHeight - (chartHeight / 5) * i
      const value = (i * 20).toString()
      this.context.fillText(value, padding - 15, y + 4)

      // 绘制刻度线
      this.context.beginPath()
      this.context.moveTo(padding - 5, y)
      this.context.lineTo(padding, y)
      this.context.stroke()
    }

    // 绘制轴标签
    this.context.font = 'bold 16px sans-serif'
    this.context.fillStyle = '#333333'

    // X轴标签
    this.context.textAlign = 'center'
    this.context.fillText('时间 (s)', padding + chartWidth / 2, padding + chartHeight + 50)

    // Y轴标签
    this.context.textAlign = 'center'
    this.context.save()
    this.context.translate(padding - 30, padding + chartHeight / 2)
    this.context.rotate(-Math.PI / 2)
    this.context.fillText('数值', 0, 0)
    this.context.restore()
  }

  drawCurveLine(padding: number, chartWidth: number, chartHeight: number) {
    if (this.data.length < 2) return

    this.context.beginPath()
    this.context.strokeStyle = '#FF6347'
    this.context.lineWidth = 3
    this.context.lineCap = 'round'
    this.context.lineJoin = 'round'

    for (let i = 0; i < this.data.length; i++) {
      const x = padding + (chartWidth / 9) * i
      const y = padding + chartHeight - (this.data[i] / 100) * chartHeight

      if (i === 0) {
        this.context.moveTo(x, y)
      } else {
        this.context.lineTo(x, y)
      }
    }

    this.context.stroke()

    // 绘制填充区域
    this.context.beginPath()
    this.context.fillStyle = 'rgba(255, 99, 71, 0.1)'

    const firstX = padding
    const firstY = padding + chartHeight - (this.data[0] / 100) * chartHeight
    this.context.moveTo(firstX, padding + chartHeight)
    this.context.lineTo(firstX, firstY)

    for (let i = 1; i < this.data.length; i++) {
      const x = padding + (chartWidth / 9) * i
      const y = padding + chartHeight - (this.data[i] / 100) * chartHeight
      this.context.lineTo(x, y)
    }

    const lastX = padding + (chartWidth / 9) * (this.data.length - 1)
    this.context.lineTo(lastX, padding + chartHeight)
    this.context.closePath()
    this.context.fill()
  }

  drawDataPoints(padding: number, chartWidth: number, chartHeight: number) {
    for (let i = 0; i < this.data.length; i++) {
      const x = padding + (chartWidth / 9) * i
      const y = padding + chartHeight - (this.data[i] / 100) * chartHeight

      // 绘制外圈
      this.context.beginPath()
      this.context.arc(x, y, 6, 0, Math.PI * 2)
      this.context.fillStyle = '#FFFFFF'
      this.context.fill()
      this.context.strokeStyle = '#FF6347'
      this.context.lineWidth = 2
      this.context.stroke()

      // 绘制内圈
      this.context.beginPath()
      this.context.arc(x, y, 3, 0, Math.PI * 2)
      this.context.fillStyle = '#FF6347'
      this.context.fill()
    }
  }
}

讨论HarmonyOS开发技术,专注于API与组件、DevEco Studio、测试、元服务和应用上架分发等。
更多推荐

 0
0 0
0- 0


 已为社区贡献44条内容

所有评论(0)