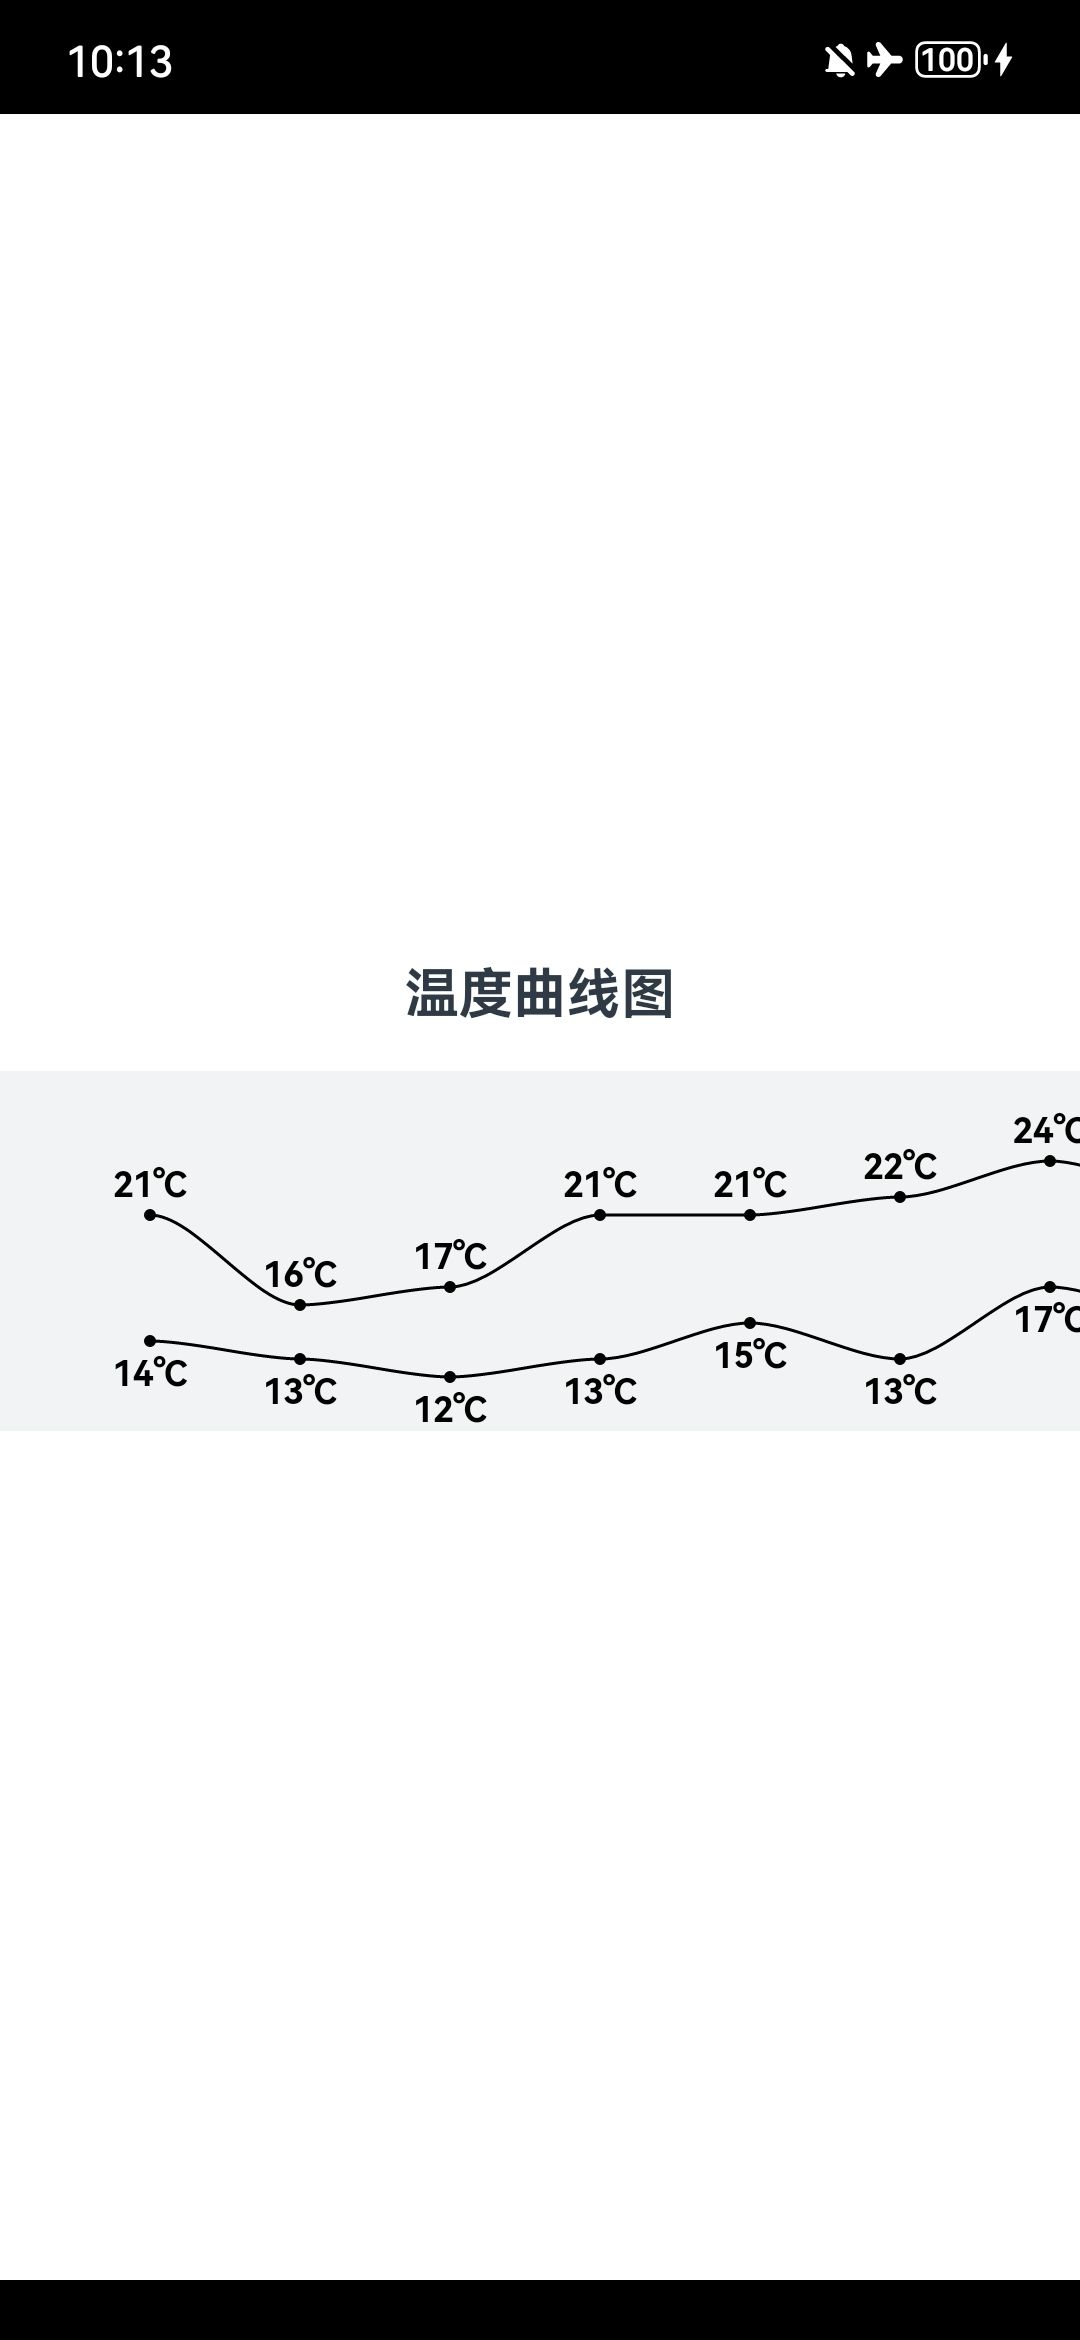
鸿蒙征文 | 使用Canvas组件绘制天气曲线图
效果图:
原理
使用贝塞尔曲线
首先可以了解一下贝塞尔曲线。
如果看不懂也没关系,这里会直接讲绘制曲线的步骤。
使用CanvasRenderingContext2D对象。
首先使用beginPath方法确定起始点。
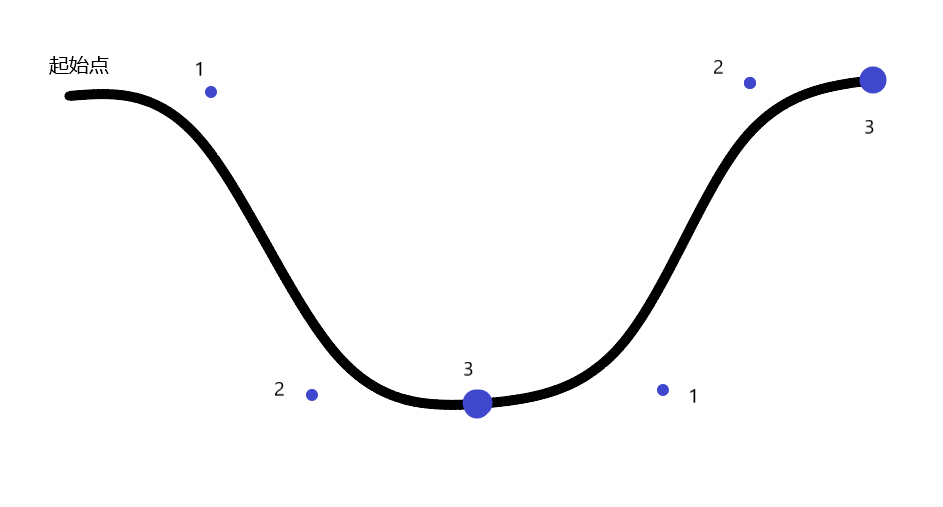
这里会循环地用到bezierCurveTo(三次贝塞尔曲线)方法。该方法需要三个点的坐标,即图上的点1、2、3。
这里的点3就表示温度的点。为了让曲线更平滑,我们让点1的高度与起始点相同,让点2的高度与点3相同;点1与起始点的水平距离是两个点3之间距离的0.3倍(可以自定义,我这里写成0.3),点2同理。
这样循环调用bezierCurveTo方法,就可以绘制出一条曲线。
注意:这里需要了解的是,在绘制完一部分曲线之后,如果没有调用stroke方法,就不会绘制曲线,该曲线也不会结束。同时该曲线最后的点就是下一次绘制的起始点。也就是说,除了第一次绘制,之后的点1的起始点都是上一次绘制的点3。记得最后调用stroke方法。
代码实现
1. 准备需要的数据和对象
hightTemperature:高温天气数据,lowTemperature:低温天气数据;
context:用于在Canvas组件上绘制;
canvasHeight:表示曲线图高度,itemWidth:表示每两天的温度点之间的距离。
highTemperature: number[] = [21, 16, 17, 21, 21, 22, 24, 22, 25, 23, 24, 26, 25, 24, 24];
lowTemperature: number[] = [14, 13, 12, 13, 15, 13, 17, 15, 16, 18, 18, 20, 22, 20, 20];

settings: RenderingContextSettings = new RenderingContextSettings(true)
context: CanvasRenderingContext2D = new CanvasRenderingContext2D(this.settings)

canvasHeight: number = 120;
itemWidth: number = 50;
2. Canvas组件
在onReady()中可以绘制图像。
Canvas(this.context)
    .width(this.highTemperature.length * this.itemWidth + this.itemWidth)
    .height(this.canvasHeight)
    .backgroundColor('#f1f3f5')
	.onReady(() => { ... })
3. 在onReady中绘制
找出高温曲线的最大值,和低温曲线的最小值,用于后续确定曲线竖直方向的比例
const maxTemperature: number = Math.max(...this.highTemperature);
const minTemperature: number = Math.min(...this.lowTemperature);
此处要求绘制的点的上下限之间的差值完全等于画布的高度的70%(可以自行调整),也就是max ~ min之间的温度要均匀分布在canvasHeight * 70%之间。
step 表示每改变 1℃,纵坐标改变的高度
我这里把曲线上下最大值、最小值与边界的距离设置为15%。
const curveChartMargin: number = this.canvasHeight * 0.15;
设置曲线样式
this.context.lineWidth = 1;
this.context.font = 'normal bold 35px';
this.context.fillStyle = '#000000';
this.context.strokeStyle = '#000000';
this.context.globalAlpha = 1;
存放坐标信息
由于同一天的高温点、低温点的x坐标相同,所以x坐标使用同一组数据。
let xPos: number[] = [];
let highYPos: number[] = [];
let lowYPos: number[] = [];
确定温度点的坐标,再绘制,并绘制温度文字
for (let i: number = 0; i < this.highTemperature.length; i++) {
    // 确定每个点的坐标,包括高温和低温,其中,高温和低温坐标的横坐标都是一致的
    let x: number = (i + 1) * this.itemWidth;
    let yHeight: number = this.canvasHeight - (curveChartMargin + (this.highTemperature[i] - minTemperature) * step);
    let yLow: number = this.canvasHeight - (curveChartMargin + (this.lowTemperature[i] - minTemperature) * step);

    // 存放数据
    xPos.push(x);
    highYPos.push(yHeight);
    lowYPos.push(yLow);

    // 给每个点画出一个圆并填充颜色,这里设置圆的半径为2
    let region: Path2D = new Path2D();
    region.ellipse(x, yHeight, 2, 2, 0, 0, Math.PI * 2);
    region.ellipse(x, yLow, 2, 2, 0, 0, Math.PI * 2);
    this.context.fill(region);

    // 准备气温文字
    let highTemperatureStr: string = `${this.highTemperature[i]}℃`;
    let lowTemperatureStr: string = `${this.lowTemperature[i]}℃`;

    // 绘制高温点文字
    this.context.fillText(highTemperatureStr, x - this.context.measureText(highTemperatureStr)
          .width / 2, yHeight - 6);
    // 绘制低温点文字
    this.context.fillText(lowTemperatureStr, x - this.context.measureText(lowTemperatureStr)
          .width / 2, yLow + 15);
}
绘制高温曲线
// 首先设置初始点
this.context.beginPath();
this.context.moveTo(xPos[0], highYPos[0]);
for (let i: number = 1; i < xPos.length; i++) {
    let x0: number = i * this.itemWidth;
    let y0: number = this.canvasHeight - (curveChartMargin + (this.highTemperature[i - 1] - minTemperature) * step);
	// 使用三次贝塞尔曲线绘制
    this.context.bezierCurveTo(x0 + (xPos[i] - x0) * 0.3, y0, xPos[i] - (xPos[i] - x0) * 0.3, highYPos[i], xPos[i], highYPos[i]);
}
this.context.stroke();
绘制低温曲线
// 记得首先要设置初始点
this.context.beginPath();
this.context.moveTo(xPos[0], lowYPos[0]);
for (let i: number = 1; i < xPos.length; i++) {
    let x0: number = i * 50;
    let y0: number = this.canvasHeight - (curveChartMargin + (this.lowTemperature[i - 1] - minTemperature) * step);

    // 使用三次贝塞尔曲线
    this.context.bezierCurveTo(x0 + (xPos[i] - x0) * 0.3, y0, xPos[i] - (xPos[i] - x0) * 0.3, lowYPos[i], xPos[i], lowYPos[i]);
}
this.context.stroke();
4. 让Canvas左右滑动
读者可能注意到,我们在Canvas的width属性中,把width设置为:
this.highTemperature.length * this.itemWidth + this.itemWidth
如果直接这样写,屏幕上只能显示Canvas的一部分。
可以把Canvas放到Scroll中,并把scrollable属性设置为ScrollDirection.Horizontal。这样就可以让Canvas左右滑动了。
Scroll() {
    Canvas(this.context)
    	.width(this.highTemperature.length * this.itemWidth + this.itemWidth)
    	.height(this.canvasHeight)
        .backgroundColor('#f1f3f5')
    	.onReady(() => { ... })
}
.scrollable(ScrollDirection.Horizontal)
.scrollBar(BarState.Off)
5. 完整代码
@Entry
@Component
struct Index {
    highTemperature: number[] = [21, 16, 17, 21, 21, 22, 24, 22, 25, 23, 24, 26, 25, 24, 24];
    lowTemperature: number[] = [14, 13, 12, 13, 15, 13, 17, 15, 16, 18, 18, 20, 22, 20, 20];

    settings: RenderingContextSettings = new RenderingContextSettings(true)
    context: CanvasRenderingContext2D = new CanvasRenderingContext2D(this.settings)

    canvasHeight: number = 120;
    itemWidth: number = 50;

    build() {
        Row() {
            Column({ space: 15 }) {
                Text('温度曲线图')
                    .fontSize(18)
                    .fontWeight(FontWeight.Bold)

                Scroll() {
                    Canvas(this.context)
                        .width(this.highTemperature.length * this.itemWidth + this.itemWidth)
                        .height(this.canvasHeight)
                        .backgroundColor('#f1f3f5')
                        .onReady(() => {
                            // 找出高温曲线的最大值,和低温曲线的最小值,用于后续确定曲线竖直方向的比例
                            const maxTemperature: number = Math.max(...this.highTemperature);
                            const minTemperature: number = Math.min(...this.lowTemperature);

                            // 此处要求绘制的点的上下限之间的差值完全等于画布的高度的70%,也就是max ~ min之间的温度要均匀分布在canvasHeight * 70% = 84之间。
                            // step 表示每改变 1℃,纵坐标改变的高度
                            const step: number = this.canvasHeight * 0.7 / (maxTemperature - minTemperature);

                            // curveChartMargin 表示曲线图大小极值与画布上下边的距离
                            const curveChartMargin: number = this.canvasHeight * 0.15;

                            // 设置曲线样式
                            this.context.lineWidth = 1;
                            this.context.font = 'normal bold 35px';
                            this.context.fillStyle = '#000000';
                            this.context.strokeStyle = '#000000';
                            this.context.globalAlpha = 1;

                            // 存放坐标的数组
                            let xPos: number[] = [];
                            let highYPos: number[] = [];
                            let lowYPos: number[] = [];

                            for (let i: number = 0; i < this.highTemperature.length; i++) {
                                // 确定每个点的坐标,包括高温和低温,其中,高温和低温坐标的横坐标都是一致的
                                let x: number = (i + 1) * this.itemWidth;
                                let yHeight: number = this.canvasHeight - (curveChartMargin + (this.highTemperature[i] - minTemperature) * step);
                                let yLow: number = this.canvasHeight - (curveChartMargin + (this.lowTemperature[i] - minTemperature) * step);

                                // 存放数据
                                xPos.push(x);
                                highYPos.push(yHeight);
                                lowYPos.push(yLow);

                                // 给每个点画出一个圆并填充颜色,这里设置圆的半径为2
                                let region: Path2D = new Path2D();
                                region.ellipse(x, yHeight, 2, 2, 0, 0, Math.PI * 2);
                                region.ellipse(x, yLow, 2, 2, 0, 0, Math.PI * 2);
                                this.context.fill(region);

                                // 准备气温文字
                                let highTemperatureStr: string = `${this.highTemperature[i]}℃`;
                                let lowTemperatureStr: string = `${this.lowTemperature[i]}℃`;

                                // 绘制高温点文字
                                this.context.fillText(highTemperatureStr, x - this.context.measureText(highTemperatureStr)
                                    .width / 2, yHeight - 6);
                                // 绘制低温点文字
                                this.context.fillText(lowTemperatureStr, x - this.context.measureText(lowTemperatureStr)
                                    .width / 2, yLow + 15);
                            }

                            // 绘制高温曲线
                            // 首先设置初始点
                            this.context.beginPath();
                            this.context.moveTo(xPos[0], highYPos[0]);
                            for (let i: number = 1; i < xPos.length; i++) {
                                let x0: number = i * this.itemWidth;
                                let y0: number = this.canvasHeight - (curveChartMargin + (this.highTemperature[i - 1] - minTemperature) * step);

                                // 使用三次贝塞尔曲线绘制
                                this.context.bezierCurveTo(x0 + (xPos[i] - x0) * 0.3, y0, xPos[i] - (xPos[i] - x0) * 0.3, highYPos[i], xPos[i], highYPos[i]);
                            }
                            this.context.stroke();

                            // 绘制低温曲线
                            // 记得首先要设置初始点
                            this.context.beginPath();
                            this.context.moveTo(xPos[0], lowYPos[0]);
                            for (let i: number = 1; i < xPos.length; i++) {
                                let x0: number = i * 50;
                                let y0: number = this.canvasHeight - (curveChartMargin + (this.lowTemperature[i - 1] - minTemperature) * step);

                                // 使用三次贝塞尔曲线
                                this.context.bezierCurveTo(x0 + (xPos[i] - x0) * 0.3, y0, xPos[i] - (xPos[i] - x0) * 0.3, lowYPos[i], xPos[i], lowYPos[i]);
                            }

                            this.context.stroke();
                        })
                }
                .scrollable(ScrollDirection.Horizontal)
                .scrollBar(BarState.Off)
            }
            .width('100%')
        }
        .height('100%')
        .border({ width: { bottom: 20 }, color: Color.Black })
    }
}

讨论HarmonyOS开发技术,专注于API与组件、DevEco Studio、测试、元服务和应用上架分发等。
更多推荐


 0
0 0
0- 0


 已为社区贡献1条内容

所有评论(0)