鸿蒙0基础学习【使用DevTools工具调试前端页面】ArkUI
摘要: Web组件支持通过DevTools调试前端页面。开发者需在应用代码中调用setWebDebuggingAccess(true)开启调试开关,并在配置文件中添加网络权限。调试步骤包括:设备连接电脑并开启USB调试,使用hdc命令转发端口(如TCP 9222),在Chrome浏览器访问chrome://inspect/#devices配置端口监听。成功转发后,DevTools将显示待调试网页,
Web组件支持使用DevTools工具调试前端页面。DevTools是一个Web前端开发调试工具,支持在电脑上调试移动设备前端页面。开发者通过[setWebDebuggingAccess()]接口开启Web组件前端页面调试能力,使用DevTools在电脑上调试移动前端网页,设备需为4.1.0及以上版本。
调试步骤
应用代码开启Web调试开关
调试网页前,需要应用侧代码调用[setWebDebuggingAccess()]接口开启Web调试开关。
如果没有开启Web调试开关,则DevTools无法发现被调试的网页。
- 在应用代码中开启Web调试开关,具体如下:
// xxx.ets
import { webview } from '@kit.ArkWeb';


@Entry
@Component
struct WebComponent {
  controller: webview.WebviewController = new webview.WebviewController();


  aboutToAppear() {
    // 配置Web开启调试模式
    webview.WebviewController.setWebDebuggingAccess(true);
  }


  build() {
    Column() {
      Web({ src: 'www.example.com', controller: this.controller })
    }
  }
}
- 开启调试功能需要在DevEco Studio应用工程hap模块的module.json5文件中增加如下权限,添加方法请参考[在配置文件中声明权限]
"requestPermissions":[
   {
     "name" : "ohos.permission.INTERNET"
   }
 ]
将设备连接至电脑
请将设备连接至电脑,随后开启开发者模式,为后续的端口转发操作做好准备。
-
请开启设备上的开发者模式,并启用USB调试功能。
(1) 终端系统查看“设置 > 系统”中是否有“开发者选项”,如果不存在,可在“设置 > 关于本机”连续七次单击“版本号”,直到提示“开启开发者模式”,点击“确认开启”后输入PIN码(如果已设置),设备将自动重启。
(2) USB数据线连接终端和电脑,在“设置 > 系统 > 开发者选项”中,打开“USB调试”开关,弹出的“允许USB调试”的弹框,点击“允许”。
-
使用hdc命令连接上设备。
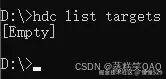
打开命令行执行如下命令,查看hdc能否发现设备。
hdc list targets- 如果命令返回设备的ID,表示hdc已连接上设备。
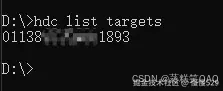
- 如果命令返回 [Empty],则说明hdc还没有发现设备。
-
进入hdc shell。
当hdc命令连接上设备后,执行如下命令,进入hdc shell。
hdc shell
端口转发
当应用代码调用setWebDebuggingAccess接口开启Web调试开关后,ArkWeb内核将启动一个domain socket的监听,以此实现DevTools对网页的调试功能。
Chrome浏览器无法直接访问到设备上的domain socket, 因此需要将设备上的domain socket转发到电脑上。
-
先在hdc shell里执行如下命令,查询ArkWeb在设备里创建的domain socket。
cat /proc/net/unix | grep devtools- 如果前几步操作无误,该命令的执行结果将显示用于查询的domain socket端口。
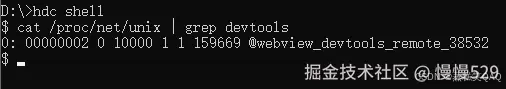
- 如果没有查询到结果, 请再次确认。
(1) 应用开启了Web调试开关。
(2) 应用使用Web组件加载了网页。
-
将查询到的domain socket转发至电脑的TCP 9222端口。
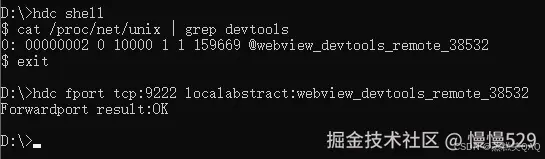
执行exit退出hdc shell。
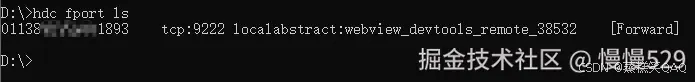
exit在命令行里执行如下命令转发端口。
hdc fport tcp:9222 localabstract:webview_devtools_remote_38532说明
“webview_devtools_remote_” 后面的数字,代表ArkWeb所在应用的进程号, 该数字不是固定的。请将”webview_devtools_remote_“后面的数字改为自己查询到的值。
如果应用的进程号发生变化,例如,应用重新启动,则需要重新配置端口转发。
命令执行成功示意图:
-
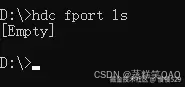
在命令行里执行如下命令,检查端口是否转发成功。
hdc fport ls- 如果有返回端口转发的任务,则说明端口转发成功。
- 如果返回 [Empty], 则说明端口转发失败。
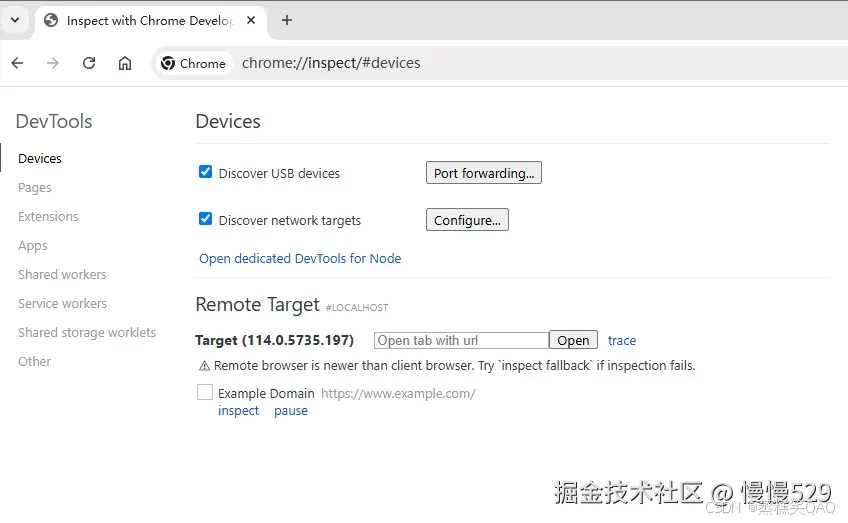
在Chrome浏览器上打开调试工具页面
-
在电脑端Chrome浏览器地址栏中输入调试工具地址 chrome://inspect/#devices 并打开该页面。
-
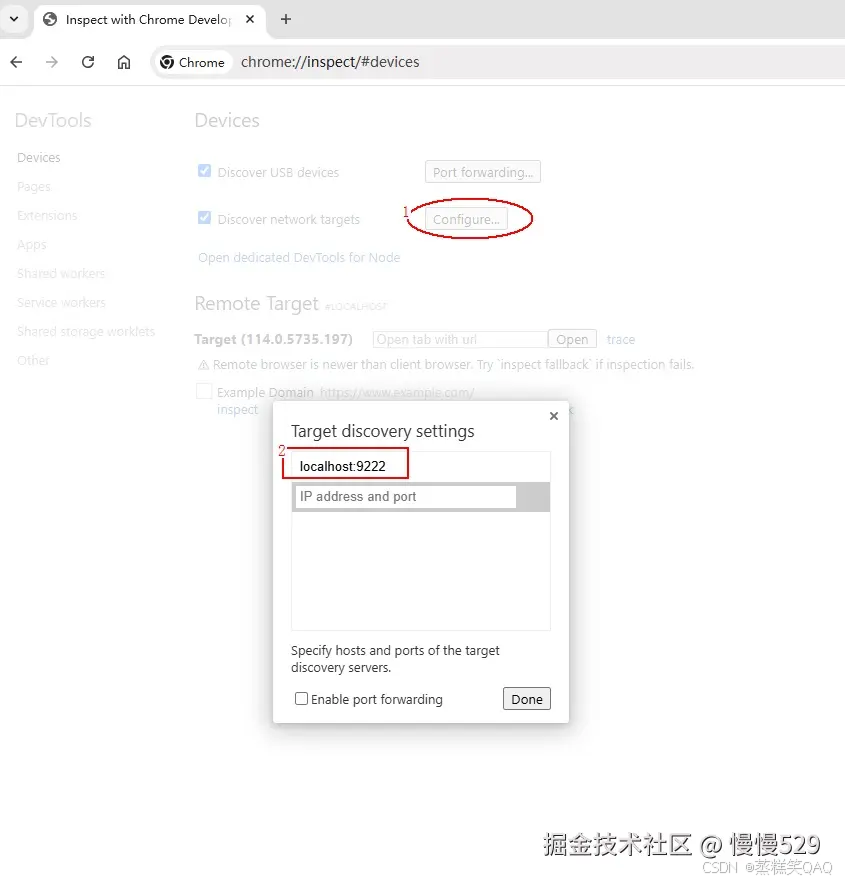
修改Chrome调试工具的配置。
需要从本地的TCP 9222端口发现被调试网页,所以请确保已勾选 “Discover network targets”。然后再进行网络配置。
(1) 点击 “Configure” 按钮。
(2) 在 “Target discovery settings” 中添加要监听的本地端口localhost:9222。
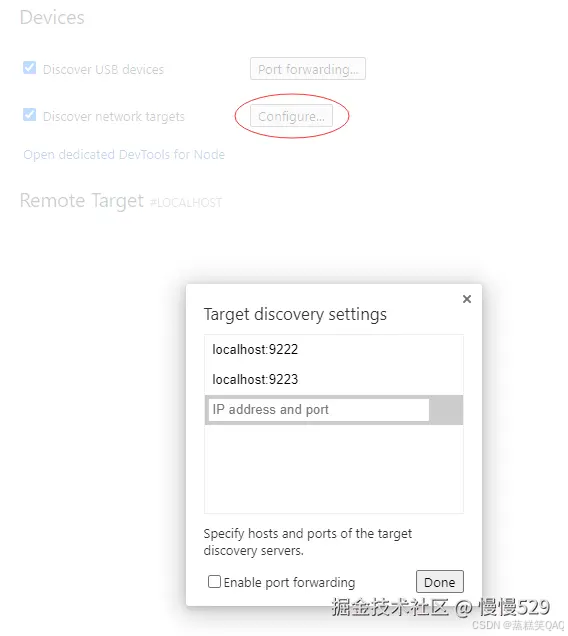
- 为了同时调试多个应用,请在Chrome浏览器的调试工具网页内,于“Devices”选项中的“configure”部分添加多个端口号。
等待发现被调试页面
如果前面的步骤执行成功,Chrome的调试页面将显示待调试的网页。
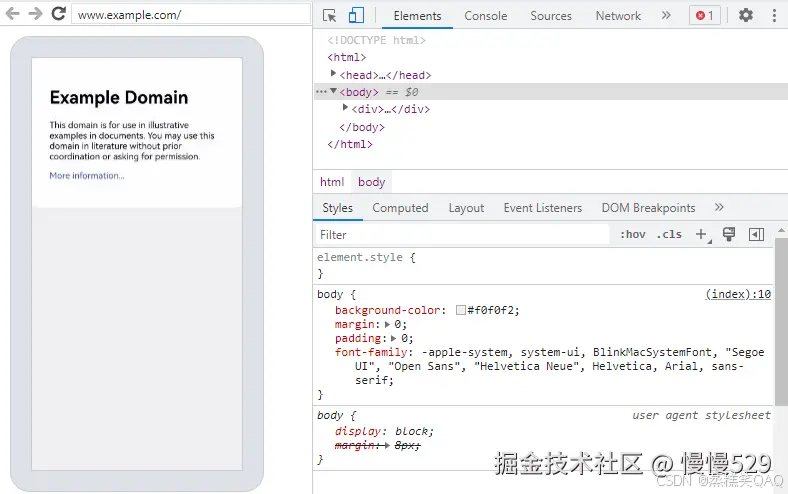
开始网页调试
便捷脚本
Windows平台
请复制以下信息建立bat文件,开启调试应用后执行。
@echo off
setlocal enabledelayedexpansion


:: Initialize port number and PID list
set PORT=9222
set PID_LIST=


:: Get the list of all forwarded ports and PIDs
for /f "tokens=2,5 delims=:_" %%a in ('hdc fport ls') do (
    if %%a gtr !PORT! (
        set PORT=%%a
    )
    for /f "tokens=1 delims= " %%c in ("%%b") do (
        set PID_LIST=!PID_LIST! %%c
    )
)


:: Increment port number for next application
set temp_PORT=!PORT!
set /a temp_PORT+=1
set PORT=!temp_PORT!


:: Get the domain socket name of devtools
for /f "tokens=*" %%a in ('hdc shell "cat /proc/net/unix | grep devtools"') do (
    set SOCKET_NAME=%%a


    :: Extract process ID
    for /f "delims=_ tokens=4" %%b in ("!SOCKET_NAME!") do set PID=%%b


    :: Check if PID already has a mapping
    echo !PID_LIST! | findstr /C:" !PID! " >nul
    if errorlevel 1 (
        :: Add mapping
        hdc fport tcp:!PORT! localabstract:webview_devtools_remote_!PID!
        if errorlevel 1 (
            echo Error: Failed to add mapping.
            pause
            exit /b
        )


        :: Add PID to list and increment port number for next application
        set PID_LIST=!PID_LIST! !PID!
        set temp_PORT=!PORT!
        set /a temp_PORT+=1
        set PORT=!temp_PORT!
    )
)


:: If no process ID was found, prompt the user to open debugging in their application code and provide the documentation link
if "!SOCKET_NAME!"=="" (
    echo No process ID was found. Please open debugging in your application code using the corresponding interface. You can find the relevant documentation at this link: [https://gitee.com/openharmony/docs/blob/master/zh-cn/application-dev/web/web-debugging-with-devtools.md]
    pause
    exit /b
)


:: Check mapping
hdc fport ls


echo.
echo Script executed successfully. Press any key to exit...
pause >nul


:: Try to open the page in Edge
start msedge chrome://inspect/#devices.com


:: If Edge is not available, then open the page in Chrome
if errorlevel 1 (
    start chrome chrome://inspect/#devices.com
)


endlocal
Linux或Mac平台
请复制以下信息建立sh文件,注意chmod以及格式转换,开启调试应用后执行。
本脚本会先删除所有的端口转发,如果有其他的工具(如:DevEco Studio)也在使用端口转发功能,会受到影响。
#!/bin/bash


# Get current fport rule list
CURRENT_FPORT_LIST=$(hdc fport ls)


# Delete the existing fport rule one by one
while IFS= read -r line; do
    # Extract the taskline
    IFS=' ' read -ra parts <<< "$line"
    taskline="${parts[1]} ${parts[2]}"


    # Delete the corresponding fport rule
    echo "Removing forward rule for $taskline"
    hdc fport rm $taskline
    result=$?


    if [ $result -eq 0 ]; then
        echo "Remove forward rule success, taskline:$taskline"
    else
        echo "Failed to remove forward rule, taskline:$taskline"
    fi


done <<< "$CURRENT_FPORT_LIST"


# Initial port number
INITIAL_PORT=9222


# Get the current port number, use initial port number if not set previously
CURRENT_PORT=${PORT:-$INITIAL_PORT}


# Get the list of all PIDs that match the condition
PID_LIST=$(hdc shell cat /proc/net/unix | grep webview_devtools_remote_ | awk -F '_' '{print $NF}')


if [ -z "$PID_LIST" ]; then
    echo "Failed to retrieve PID from the device"
    exit 1
fi


# Increment the port number
PORT=$CURRENT_PORT


# Forward ports for each application one by one
for PID in $PID_LIST; do
    # Increment the port number
    PORT=$((PORT + 1))


    # Execute the hdc fport command
    hdc fport tcp:$PORT localabstract:webview_devtools_remote_$PID


    # Check if the command executed successfully
    if [ $? -ne 0 ]; then
        echo "Failed to execute hdc fport command"
        exit 1
    fi
done


# List all forwarded ports
hdc fport ls
常见问题与解决方法
hdc无法发现设备
问题现象
在命令行里执行如下命令后,没有列出设备ID。
hdc list targets
解决方法
- 请确保设备上的USB调试开关已开启。
- 请确保设备与电脑相连。
hdc的命令显示设备"未授权"或"unauthorized"
问题现象
执行hdc命令时,提示设备"未授权"或"unauthorized"。
问题原因
设备没有授权该台电脑进行调试。
解决方法
开启USB调试开关的设备连接没有授权的电脑后,会弹框提示"是否允许USB调试?",请选择允许。
找不到DevTools的domain socket
问题现象
在hdc shell里执行如下命令后,没有结果。
cat /proc/net/unix | grep devtools
解决方法
- 请确保应用[开启了Web调试开关]
- 请确保应用使用Web组件加载了网页。
端口转发不成功
问题现象
在命令行里执行如下命令后,没有列出之前设置过转发任务。
hdc fport ls
解决方法
-
请确保设备里的domain socket存在。
-
请确保电脑端的tcp:9222没有被占用。
如果tcp:9222被占用,可以将domain socket转发到其他未被占用的TCP端口, 比如9223等。
如果转发到了新的TCP端口, 需要同步修改电脑端Chrome浏览器"Target discovery settings"中的端口号。
端口转发成功后,电脑端Chrome无法发现被调试网页
问题现象
电脑端Chrome浏览器无法发现被调试网页。
问题原因
端口转发失效可能是以下原因:
- 设备与电脑断连,会导致hdc里的所有转发任务被清空。
- hdc服务重启,也会导致hdc里的所有转发任务被清空。
- 设备里应用的进程号发生了变更(应用重新启动等),会导致hdc里旧的转发任务失效。
- 多个转发任务转发到了同一个端口等异常配置,会导致转发异常。
解决方法
-
请确保电脑端的本地tcp:9222(其他TCP端口同理)没有被占用。
-
请确保设备端的domain socket还存在。
-
请确保domain socket名称里的进程号与被调试的应用的进程号相同。
-
请删除hdc里其他不必要的转发任务。
-
转发成功后,请用电脑端的Chrome浏览器打开网址 http://localhost:9222/json ,URL里的9222需要改为自己实际配置的TCP端口。
- 如果网页有内容, 说明端口转发成功,请在Chrome的调试页面[等待被调试页面的出现]。
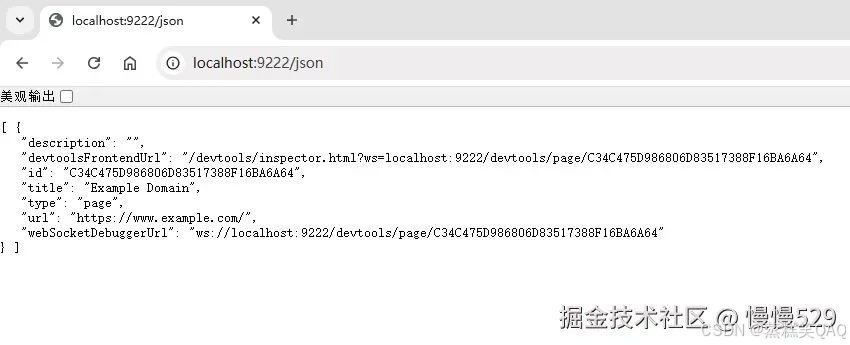
-   如果展示的是错误网页, 说明端口转发失败, 请参阅[端口转发不成功]中的解决方法。

    ![]()
-
电脑端Chrome浏览器打开 http://localhost:9222/json 页面有内容,但是Chrome的调试工具界面还是无法发现调试目标。
-
请确保Chrome调试工具界面的 “Configure” 中配置的端口号,与端口转发指定的TCP端口号一致。
-
在本文档中,默认使用的TCP端口号为9222。
如果开发者使用了其他的TCP端口号(比如9223),请同时修改[端口转发]中的TCP端口号和[Chrome调试工具界面"Configure"配置]中的端口号。
-


讨论HarmonyOS开发技术,专注于API与组件、DevEco Studio、测试、元服务和应用上架分发等。
更多推荐


 17
17 0
0- 0


 已为社区贡献11条内容

所有评论(0)