鸿蒙KMP打造数据统计工具
本文介绍了一个基于Kotlin Multiplatform(KMP)和OpenHarmony平台的数据统计库实现。该库通过KMP技术实现了跨平台复用,支持JVM、JS和OpenHarmony/ArkTS平台。核心功能包括求和、平均值、最大最小值、中位数、标准差、方差、百分位数等统计计算,并提供统计报告生成能力。采用模块化设计,包含配置管理、数据转换和各类统计算法实现,能够满足现代应用开发中的数据统

欢迎加入开源鸿蒙跨平台社区:https://openharmonycrossplatform.csdn.net
项目概述
数据统计是现代应用开发中的核心功能。无论是在数据分析、性能监控、业务报表还是决策支持中,都需要进行数据的统计和计算。然而,不同的编程语言和平台对数据统计的实现方式各不相同,这导致开发者需要在不同平台上重复编写类似的逻辑。
本文介绍一个基于 Kotlin Multiplatform (KMP) 和 OpenHarmony 平台的数据统计库示例。这个库提供了一套完整的数据统计能力,包括求和、平均值、最大最小值、标准差等功能。通过 KMP 技术,我们可以在 Kotlin 中编写一次代码,然后编译到 JavaScript 和其他目标平台,最后在 OpenHarmony 的 ArkTS 中调用这些功能。
技术架构
多平台支持
- Kotlin/JVM: 后端服务和桌面应用
- Kotlin/JS: Web 应用和浏览器环境
- OpenHarmony/ArkTS: 鸿蒙操作系统应用
核心功能模块
- 求和: 计算数据总和
- 平均值: 计算数据平均值
- 最大最小值: 获取最大和最小值
- 中位数: 计算中位数
- 标准差: 计算标准差
- 方差: 计算方差
- 百分位数: 计算百分位数
- 统计汇总: 生成完整统计报告
Kotlin 实现
核心统计类
// 文件: src/commonMain/kotlin/DataStatistics.kt

/**
 * 数据统计工具类
 * 提供各种数据统计功能
 */
class DataStatistics {

    data class StatisticsResult(
        val data: List<Double>,
        val count: Int,
        val sum: Double,
        val average: Double,
        val min: Double,
        val max: Double,
        val median: Double,
        val variance: Double,
        val standardDeviation: Double,
        val statisticsTime: Long
    )

    data class StatisticsConfig(
        val enablePrecision: Boolean = true,
        val decimalPlaces: Int = 2,
        val enableLogging: Boolean = false
    )

    private var config = StatisticsConfig()

    /**
     * 设置统计配置
     * @param config 配置对象
     */
    fun setConfig(config: StatisticsConfig) {
        this.config = config
    }

    /**
     * 计算统计信息
     * @param data 数据列表
     * @return 统计结果
     */
    fun calculateStatistics(data: List<Int>): StatisticsResult {
        val startTime = System.currentTimeMillis()
        val doubleData = data.map { it.toDouble() }

        if (doubleData.isEmpty()) {
            return StatisticsResult(doubleData, 0, 0.0, 0.0, 0.0, 0.0, 0.0, 0.0, 0.0, 0)
        }

        val count = doubleData.size
        val sum = doubleData.sum()
        val average = sum / count
        val min = doubleData.minOrNull() ?: 0.0
        val max = doubleData.maxOrNull() ?: 0.0
        val median = calculateMedian(doubleData)
        val variance = calculateVariance(doubleData, average)
        val standardDeviation = Math.sqrt(variance)

        val statisticsTime = System.currentTimeMillis() - startTime

        return StatisticsResult(
            doubleData,
            count,
            sum,
            average,
            min,
            max,
            median,
            variance,
            standardDeviation,
            statisticsTime
        )
    }

    /**
     * 计算中位数
     * @param data 排序后的数据
     * @return 中位数
     */
    private fun calculateMedian(data: List<Double>): Double {
        val sorted = data.sorted()
        return if (sorted.size % 2 == 0) {
            (sorted[sorted.size / 2 - 1] + sorted[sorted.size / 2]) / 2
        } else {
            sorted[sorted.size / 2]
        }
    }

    /**
     * 计算方差
     * @param data 数据列表
     * @param average 平均值
     * @return 方差
     */
    private fun calculateVariance(data: List<Double>, average: Double): Double {
        if (data.isEmpty()) return 0.0
        val sumOfSquares = data.sumOf { (it - average) * (it - average) }
        return sumOfSquares / data.size
    }

    /**
     * 计算百分位数
     * @param data 数据列表
     * @param percentile 百分位(0-100)
     * @return 百分位数
     */
    fun calculatePercentile(data: List<Int>, percentile: Double): Double {
        if (data.isEmpty() || percentile < 0 || percentile > 100) return 0.0

        val sorted = data.sorted()
        val index = (percentile / 100.0) * (sorted.size - 1)
        val lower = index.toInt()
        val upper = lower + 1

        return if (upper >= sorted.size) {
            sorted[lower].toDouble()
        } else {
            val weight = index - lower
            sorted[lower] * (1 - weight) + sorted[upper] * weight
        }
    }

    /**
     * 计算四分位数
     * @param data 数据列表
     * @return 四分位数(Q1, Q2, Q3)
     */
    fun calculateQuartiles(data: List<Int>): Map<String, Double> {
        return mapOf(
            "Q1" to calculatePercentile(data, 25.0),
            "Q2" to calculatePercentile(data, 50.0),
            "Q3" to calculatePercentile(data, 75.0)
        )
    }

    /**
     * 计算范围
     * @param data 数据列表
     * @return 范围(最大值 - 最小值)
     */
    fun calculateRange(data: List<Int>): Double {
        if (data.isEmpty()) return 0.0
        return (data.maxOrNull() ?: 0) - (data.minOrNull() ?: 0).toDouble()
    }

    /**
     * 计算四分位距
     * @param data 数据列表
     * @return 四分位距(Q3 - Q1)
     */
    fun calculateIQR(data: List<Int>): Double {
        val quartiles = calculateQuartiles(data)
        return (quartiles["Q3"] ?: 0.0) - (quartiles["Q1"] ?: 0.0)
    }

    /**
     * 生成统计报告
     * @param result 统计结果
     * @return 报告字符串
     */
    fun generateStatisticsReport(result: StatisticsResult): String {
        val report = StringBuilder()
        report.append("数据统计报告\n")
        report.append("=".repeat(40)).append("\n")
        report.append("数据个数: ${result.count}\n")
        report.append("总和: ${formatNumber(result.sum)}\n")
        report.append("平均值: ${formatNumber(result.average)}\n")
        report.append("最小值: ${formatNumber(result.min)}\n")
        report.append("最大值: ${formatNumber(result.max)}\n")
        report.append("中位数: ${formatNumber(result.median)}\n")
        report.append("方差: ${formatNumber(result.variance)}\n")
        report.append("标准差: ${formatNumber(result.standardDeviation)}\n")
        report.append("统计耗时: ${result.statisticsTime}ms\n")

        return report.toString()
    }

    /**
     * 格式化数字
     * @param value 数值
     * @return 格式化后的字符串
     */
    private fun formatNumber(value: Double): String {
        return if (config.enablePrecision) {
            String.format("%.${config.decimalPlaces}f", value)
        } else {
            value.toString()
        }
    }
}
Kotlin 实现的核心特点
Kotlin 实现中的统计功能充分利用了 Kotlin 标准库的数学计算能力。求和使用了 sum 方法。平均值使用了简单除法。
最大最小值使用了 maxOrNull 和 minOrNull 方法。中位数使用了排序和索引计算。方差使用了平方和计算。
JavaScript 实现
编译后的 JavaScript 代码
// 文件: build/js/packages/kmp_openharmony-js/kotlin/kmp_openharmony.js
// (由 Kotlin 编译器自动生成)

/**
 * DataStatistics 类的 JavaScript 版本
 * 通过 Kotlin/JS 编译器从 Kotlin 源代码生成
 */
class DataStatistics {
  constructor() {
    this.config = {
      enablePrecision: true,
      decimalPlaces: 2,
      enableLogging: false
    };
  }

  /**
   * 设置统计配置
   * @param {Object} config - 配置对象
   */
  setConfig(config) {
    this.config = { ...this.config, ...config };
  }

  /**
   * 计算统计信息
   * @param {Array} data - 数据列表
   * @returns {Object} 统计结果
   */
  calculateStatistics(data) {
    const startTime = Date.now();
    const doubleData = data.map(v => parseFloat(v));

    if (doubleData.length === 0) {
      return {
        data: doubleData,
        count: 0,
        sum: 0,
        average: 0,
        min: 0,
        max: 0,
        median: 0,
        variance: 0,
        standardDeviation: 0,
        statisticsTime: 0
      };
    }

    const count = doubleData.length;
    const sum = doubleData.reduce((a, b) => a + b, 0);
    const average = sum / count;
    const min = Math.min(...doubleData);
    const max = Math.max(...doubleData);
    const median = this.calculateMedian(doubleData);
    const variance = this.calculateVariance(doubleData, average);
    const standardDeviation = Math.sqrt(variance);

    const statisticsTime = Date.now() - startTime;

    return {
      data: doubleData,
      count: count,
      sum: sum,
      average: average,
      min: min,
      max: max,
      median: median,
      variance: variance,
      standardDeviation: standardDeviation,
      statisticsTime: statisticsTime
    };
  }

  /**
   * 计算中位数
   * @param {Array} data - 排序后的数据
   * @returns {number} 中位数
   */
  calculateMedian(data) {
    const sorted = [...data].sort((a, b) => a - b);
    if (sorted.length % 2 === 0) {
      return (sorted[sorted.length / 2 - 1] + sorted[sorted.length / 2]) / 2;
    } else {
      return sorted[Math.floor(sorted.length / 2)];
    }
  }

  /**
   * 计算方差
   * @param {Array} data - 数据列表
   * @param {number} average - 平均值
   * @returns {number} 方差
   */
  calculateVariance(data, average) {
    if (data.length === 0) return 0;
    const sumOfSquares = data.reduce((sum, val) => sum + Math.pow(val - average, 2), 0);
    return sumOfSquares / data.length;
  }

  /**
   * 计算百分位数
   * @param {Array} data - 数据列表
   * @param {number} percentile - 百分位(0-100)
   * @returns {number} 百分位数
   */
  calculatePercentile(data, percentile) {
    if (data.length === 0 || percentile < 0 || percentile > 100) return 0;

    const sorted = [...data].sort((a, b) => a - b);
    const index = (percentile / 100) * (sorted.length - 1);
    const lower = Math.floor(index);
    const upper = lower + 1;

    if (upper >= sorted.length) {
      return sorted[lower];
    } else {
      const weight = index - lower;
      return sorted[lower] * (1 - weight) + sorted[upper] * weight;
    }
  }

  /**
   * 计算四分位数
   * @param {Array} data - 数据列表
   * @returns {Object} 四分位数
   */
  calculateQuartiles(data) {
    return {
      Q1: this.calculatePercentile(data, 25),
      Q2: this.calculatePercentile(data, 50),
      Q3: this.calculatePercentile(data, 75)
    };
  }

  /**
   * 计算范围
   * @param {Array} data - 数据列表
   * @returns {number} 范围
   */
  calculateRange(data) {
    if (data.length === 0) return 0;
    return Math.max(...data) - Math.min(...data);
  }
}
JavaScript 实现的特点
JavaScript 版本完全由 Kotlin/JS 编译器自动生成,确保了与 Kotlin 版本的行为完全一致。JavaScript 的数学方法提供了统计计算能力。
reduce 方法用于求和。Math.min/max 用于获取极值。sort 方法用于排序。
ArkTS 调用代码
OpenHarmony 应用集成
// 文件: kmp_ceshiapp/entry/src/main/ets/pages/DataStatisticsPage.ets

import { DataStatistics } from '../../../../../../../build/js/packages/kmp_openharmony-js/kotlin/kmp_openharmony';

@Entry
@Component
struct DataStatisticsPage {
  @State selectedStatistic: string = 'calculate';
  @State inputData: string = '';
  @State result: string = '';
  @State resultTitle: string = '';

  private dataStatistics = new DataStatistics();

  private statistics = [
    { name: '📊 完整统计', value: 'calculate' },
    { name: '📈 四分位数', value: 'quartiles' },
    { name: '📏 范围', value: 'range' },
    { name: '📐 四分位距', value: 'iqr' },
    { name: '🎯 百分位', value: 'percentile' },
    { name: '📋 报告', value: 'report' },
    { name: '🔍 详细', value: 'detailed' },
    { name: '🔄 演示', value: 'demo' }
  ];

  build() {
    Column() {
      // 标题
      Text('📊 数据统计库示例')
        .fontSize(28)
        .fontWeight(FontWeight.Bold)
        .fontColor('#FFFFFF')
        .width('100%')
        .padding(20)
        .backgroundColor('#1A237E')
        .textAlign(TextAlign.Center)

      Scroll() {
        Column() {
          // 统计类型选择
          Column() {
            Text('选择统计类型')
              .fontSize(14)
              .fontWeight(FontWeight.Bold)
              .fontColor('#333333')
              .margin({ bottom: 12 })

            Flex({ wrap: FlexWrap.Wrap }) {
              ForEach(this.statistics, (stat: { name: string; value: string }) => {
                Button(stat.name)
                  .layoutWeight(1)
                  .height(40)
                  .margin({ right: 8, bottom: 8 })
                  .backgroundColor(this.selectedStatistic === stat.value ? '#1A237E' : '#E0E0E0')
                  .fontColor(this.selectedStatistic === stat.value ? '#FFFFFF' : '#333333')
                  .fontSize(11)
                  .onClick(() => {
                    this.selectedStatistic = stat.value;
                    this.result = '';
                    this.resultTitle = '';
                  })
              })
            }
            .width('100%')
          }
          .width('95%')
          .margin({ top: 16, left: '2.5%', right: '2.5%', bottom: 16 })
          .padding(12)
          .backgroundColor('#FFFFFF')
          .borderRadius(6)

          // 数据输入
          Column() {
            Text('输入数据(用逗号分隔)')
              .fontSize(14)
              .fontWeight(FontWeight.Bold)
              .fontColor('#333333')
              .margin({ bottom: 8 })

            TextInput({ placeholder: '例如:10,20,30,40,50,60,70,80,90', text: this.inputData })
              .onChange((value) => this.inputData = value)
              .width('100%')
              .height(50)
              .padding(12)
              .border({ width: 1, color: '#4DB6AC' })
              .borderRadius(6)
              .fontSize(12)
          }
          .width('95%')
          .margin({ left: '2.5%', right: '2.5%', bottom: 16 })
          .padding(12)
          .backgroundColor('#FFFFFF')
          .borderRadius(6)

          // 操作按钮
          Row() {
            Button('✨ 统计')
              .layoutWeight(1)
              .height(44)
              .backgroundColor('#1A237E')
              .fontColor('#FFFFFF')
              .fontSize(14)
              .fontWeight(FontWeight.Bold)
              .borderRadius(6)
              .onClick(() => this.executeStatistics())

            Blank()
              .width(12)

            Button('🔄 清空')
              .layoutWeight(1)
              .height(44)
              .backgroundColor('#F5F5F5')
              .fontColor('#1A237E')
              .fontSize(14)
              .border({ width: 1, color: '#4DB6AC' })
              .borderRadius(6)
              .onClick(() => {
                this.inputData = '';
                this.result = '';
                this.resultTitle = '';
              })
          }
          .width('95%')
          .margin({ left: '2.5%', right: '2.5%', bottom: 16 })

          // 结果显示
          if (this.resultTitle) {
            Column() {
              Text(this.resultTitle)
                .fontSize(16)
                .fontWeight(FontWeight.Bold)
                .fontColor('#FFFFFF')
                .width('100%')
                .padding(12)
                .backgroundColor('#1A237E')
                .borderRadius(6)
                .textAlign(TextAlign.Center)
                .margin({ bottom: 12 })

              Scroll() {
                Text(this.result)
                  .fontSize(12)
                  .fontColor('#333333')
                  .fontFamily('monospace')
                  .textAlign(TextAlign.Start)
                  .width('100%')
                  .padding(12)
                  .selectable(true)
              }
              .width('100%')
              .height(300)
              .backgroundColor('#F9F9F9')
              .border({ width: 1, color: '#4DB6AC' })
              .borderRadius(6)
            }
            .width('95%')
            .margin({ left: '2.5%', right: '2.5%', bottom: 16 })
            .padding(12)
            .backgroundColor('#FFFFFF')
            .borderRadius(6)
          }
        }
        .width('100%')
      }
      .layoutWeight(1)
      .width('100%')
    }
    .width('100%')
    .height('100%')
    .backgroundColor('#F5F5F5')
  }

  private executeStatistics() {
    const inputStr = this.inputData || '10,20,30,40,50,60,70,80,90';
    const data = inputStr.split(',').map(s => parseInt(s.trim(), 10)).filter(n => !isNaN(n));

    if (data.length === 0) {
      this.resultTitle = '❌ 错误';
      this.result = '请输入有效的数据';
      return;
    }

    try {
      switch (this.selectedStatistic) {
        case 'calculate':
          const result = this.dataStatistics.calculateStatistics(data);
          this.resultTitle = '📊 完整统计';
          this.result = `数据: ${data}\n个数: ${result.count}\n总和: ${result.sum.toFixed(2)}\n平均值: ${result.average.toFixed(2)}\n最小值: ${result.min}\n最大值: ${result.max}\n中位数: ${result.median.toFixed(2)}\n标准差: ${result.standardDeviation.toFixed(2)}`;
          break;

        case 'quartiles':
          const quartiles = this.dataStatistics.calculateQuartiles(data);
          this.resultTitle = '📈 四分位数';
          this.result = `数据: ${data}\nQ1 (25%): ${quartiles.Q1.toFixed(2)}\nQ2 (50%): ${quartiles.Q2.toFixed(2)}\nQ3 (75%): ${quartiles.Q3.toFixed(2)}`;
          break;

        case 'range':
          const range = this.dataStatistics.calculateRange(data);
          this.resultTitle = '📏 范围';
          this.result = `数据: ${data}\n范围 (最大-最小): ${range}`;
          break;

        case 'iqr':
          const quartiles2 = this.dataStatistics.calculateQuartiles(data);
          const iqr = quartiles2.Q3 - quartiles2.Q1;
          this.resultTitle = '📐 四分位距';
          this.result = `数据: ${data}\nIQR (Q3-Q1): ${iqr.toFixed(2)}`;
          break;

        case 'percentile':
          const p90 = this.dataStatistics.calculatePercentile(data, 90);
          this.resultTitle = '🎯 百分位';
          this.result = `数据: ${data}\n90百分位: ${p90.toFixed(2)}`;
          break;

        case 'report':
          const reportResult = this.dataStatistics.calculateStatistics(data);
          const report = this.dataStatistics.generateStatisticsReport(reportResult);
          this.resultTitle = '📋 统计报告';
          this.result = report;
          break;

        case 'detailed':
          const detailedResult = this.dataStatistics.calculateStatistics(data);
          this.resultTitle = '🔍 详细统计';
          this.result = `数据个数: ${detailedResult.count}\n总和: ${detailedResult.sum.toFixed(2)}\n平均值: ${detailedResult.average.toFixed(2)}\n最小值: ${detailedResult.min}\n最大值: ${detailedResult.max}\n中位数: ${detailedResult.median.toFixed(2)}\n方差: ${detailedResult.variance.toFixed(2)}\n标准差: ${detailedResult.standardDeviation.toFixed(2)}\n耗时: ${detailedResult.statisticsTime}ms`;
          break;

        case 'demo':
          const demoData = [10, 20, 30, 40, 50, 60, 70, 80, 90];
          const demoResult = this.dataStatistics.calculateStatistics(demoData);
          this.resultTitle = '🔄 演示数据';
          this.result = `演示数据: ${demoData}\n平均值: ${demoResult.average.toFixed(2)}\n标准差: ${demoResult.standardDeviation.toFixed(2)}\n范围: ${demoResult.max - demoResult.min}`;
          break;
      }
    } catch (e) {
      this.resultTitle = '❌ 统计出错';
      this.result = `错误: ${e}`;
    }
  }
}
ArkTS 集成的关键要点
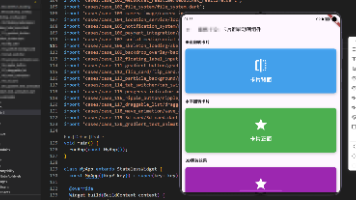
在 OpenHarmony 应用中集成统计工具库需要考虑多种统计操作和用户体验。我们设计了一个灵活的 UI,能够支持不同的统计操作。
统计类型选择界面使用了 Flex 布局和 FlexWrap 来实现响应式的按钮排列。数据输入使用了 TextInput 组件。
结果显示使用了可选择的文本,这样用户可以轻松复制统计结果。对于不同的统计类型,我们显示了相应的统计处理结果。
工作流程详解
数据统计的完整流程
- 统计类型选择: 用户在 ArkTS UI 中选择要执行的统计类型
- 数据输入: 用户输入要统计的数据
- 处理执行: 调用 DataStatistics 的相应方法
- 结果展示: 将统计结果显示在 UI 中
跨平台一致性
通过 KMP 技术,我们确保了在所有平台上的行为一致性。无论是在 Kotlin/JVM、Kotlin/JS 还是通过 ArkTS 调用,数据统计的逻辑和结果都是完全相同的。
实际应用场景
业务数据分析
在分析业务数据时,需要进行统计计算。这个工具库提供了完整的业务数据统计功能。
性能监控
在监控应用性能时,需要进行性能指标统计。这个工具库提供了性能监控统计能力。
报表生成
在生成报表时,需要进行数据统计。这个工具库提供了报表数据统计功能。
数据分析
在进行数据分析时,需要进行统计计算。这个工具库提供了数据分析统计能力。
性能优化
算法优化
在处理大量数据时,应该选择高效的统计算法以提高性能。
缓存统计结果
在频繁进行相同统计时,可以缓存统计结果以避免重复计算。
安全性考虑
数据验证
在进行数据统计时,应该进行验证以确保数据的有效性。
溢出防护
在处理大数据统计时,应该防止数值溢出等问题。
总结
这个 KMP OpenHarmony 数据统计库示例展示了如何使用现代的跨平台技术来处理常见的数据统计任务。通过 Kotlin Multiplatform 技术,我们可以在一个地方编写业务逻辑,然后在多个平台上使用。
数据统计是应用开发中的重要功能。通过使用这样的工具库,开发者可以快速、可靠地实现各种统计操作,从而提高应用的数据分析能力。
在实际应用中,建议根据具体的需求进行定制和扩展,例如添加更多的统计方法、实现更复杂的统计模型等高级特性。同时,定期进行性能测试和优化,确保应用的统计系统保持高效运行。

讨论HarmonyOS开发技术,专注于API与组件、DevEco Studio、测试、元服务和应用上架分发等。
更多推荐

 22
22 0
0- 0


 已为社区贡献5条内容

所有评论(0)