在React Native中开发鸿组件采用了典型的函数式组件配合 Hooks 的开发模式,父组件向子组件传递数据(通过 props),以及用户交互事件从子组件向上传递(通过回调函数)
数据建模与跨端语义
- 数据以 TypeScript 类型建模(StatItem、ActivityTrend、GrowthData),所有渲染都基于纯 JS 对象,避免平台特化字段。跨端层面,类型定义充当“协议”,通过 props 将语义传递到视图,利于在鸿蒙端保持一致的桥接行为。
- useState 仅用于初始化静态数据集合,页面逻辑没有副作用订阅与异步数据源,Bridge 负载主要来自渲染树构建与轻量交互(Alert)。这种静态态势对三端帧稳定性更友好,易于衡量生始化合成性能。
统计卡片的桥接友好性
- StatCard 完全使用 RN 基础组件(View/Text/touchable),图标采用 Emoji 文本,避免第三方库桥接的风险;但 Emoji 在三端的字体与渲染有差异,若追求视觉一致性,建议统一到矢量图标(react-native-svg 或图标字体),前提是鸿蒙端的 SVG/字体桥接成熟。
- 卡片内的数值和变化率为纯文本计算输出,计算在 JS 线程完成,不依赖原生格式化或平台 API;这种“JS 纯计算 → UI 文本”在 Bridge 上只传递最终字符串,端间表现一致。
趋势图:JS 布局柱形 vs 原生矢量
- ActivityTrendChart 与 GrowthChart 以 View 组成柱形图,通过百分比 height 表达柱高。计算 maxValue 后按 value/maxValue→百分比渲染,属于“布局驱动”的图形。优势是零依赖、简单,劣势是每次更新触发布局重算,JS→UI 同步链较长。
- 在跨端场景,矢量绘制更可控。使用 react-native-svg 的 Rect/Line 可以将每个柱的几何参数直接下发到原生绘制后端(iOS CoreGraphics、Android Skia、鸿蒙 ArkUI 后端),合成层更新比布局驱动更稳定,尤其在高密度数据或动画场景。
- 如果需要入场动画或动态刷新,transform/opacity 的原生驱动比 height 更稳健;height 会触发布局与测量,transform 则走合成层更新。用 Animated/Reanimated 将进度绑定到 UI 线程,可显著降低跨端抖动。
import React from 'react';
import { View } from 'react-native';
import Svg, { Rect, Text as SvgText } from 'react-native-svg';

const Bars = ({ data, width = 320, height = 160, color = '#3b82f6' }: { data: { label: string; value: number }[]; width?: number; height?: number; color?: string }) => {
  const max = Math.max(...data.map(d => d.value), 1);
  const bw = width / data.length;
  return (
    <View style={{ width, height }}>
      <Svg width={width} height={height}>
        {data.map((d, i) => {
          const h = (d.value / max) * (height - 24);
          return (
            <>
              <Rect key={`bar-${i}`} x={i * bw + bw * 0.2} y={height - h} width={bw * 0.6} height={h} fill={color} rx={4} />
              <SvgText key={`label-${i}`} x={i * bw + bw * 0.5} y={height - 4} fontSize="10" textAnchor="middle">{d.label}</SvgText>
            </>
          );
        })}
      </Svg>
    </View>
  );
};
列表与虚拟化
- 文件中已引入 FlatList,但当前页面的图表和统计项使用 map 渲染。对于扩展到数十或上百条的明细数据(detailData)或统计卡片(stats),跨端建议切换 FlatList,利用虚拟化与回收减少 RN Bridge 传输与原生视图树压力。
- FlatList 配合 keyExtractor、getItemLayout 与 React.memo 子项组件能在三端获得稳定的滚动与重绘性能,尤其在鸿蒙 ArkUI 后端中有效降低合成与布局开销。
import React, { memo, useCallback } from 'react';
import { FlatList, View, Text } from 'react-native';

const Row = memo(({ title, value, change }: { title: string; value: string | number; change: number }) => (
  <View>
    <Text>{title}</Text>
    <Text>{value}</Text>
    <Text style={{ color: change >= 0 ? '#10b981' : '#ef4444' }}>{change >= 0 ? `+${change}%` : `${change}%`}</Text>
  </View>
));

const DetailList = ({ data }: { data: { title: string; value: string | number; change: number }[] }) => {
  const renderItem = useCallback(({ item }) => <Row {...item} />, []);
  const keyExtractor = useCallback((_, i) => `${i}`, []);
  return <FlatList data={data} renderItem={renderItem} keyExtractor={keyExtractor} />;
};
状态更新与性能
- 页面数据均为 useState 的静态初始值,交互仅有 Alert 弹窗。刷新逻辑通过 refreshStats 发起提示而未真正更新数据,这是演示合理的“纯前端交互”,但在真实场景应配合数据源与批量 setState,减少多次微更新带来的桥面消息。
- 当趋势图或数值需要频繁刷新,建议以“单一消息源 + 原生驱动插值”设计:JS 层只下发目标值与时长,UI 线程完成插值与绘制。三端一致性更好,避免 JS 定时器漂移。
在移动端开发领域,跨平台框架的选择一直是技术决策的关键议题。React Native 作为 Facebook 推出的跨端解决方案,凭借其"Learn Once, Write Anywhere"的理念,在业界获得了广泛的应用。而随着鸿蒙生态的快速发展,React Native 与鸿蒙的结合也成为了一个值得深入探讨的技术方向。本文将从代码架构和实现细节的角度,分析一个社交数据统计页面的技术实现。
组件化设计思想
该应用采用了典型的函数式组件配合 Hooks 的开发模式,这是 React Native 推荐的最佳实践之一。根组件 SocialDataStatisticsApp 作为一个容器,承载了整个应用的状态管理和子组件的协调工作。
const SocialDataStatisticsApp: React.FC = () => {
  const [stats] = useState<StatItem[]>([...]);
  const [activityTrend] = useState<ActivityTrend[]>([...]);
  const [growthData] = useState<GrowthData[]>([...]);
  // ...
}
在鸿蒙端使用 React Native 时,这种组件化思想同样适用。ArkTS 作为鸿蒙的开发语言,其组件化理念与 React Native 有异曲同工之妙。通过将复杂页面拆分为多个职责单一的子组件,可以显著提升代码的可维护性和可测试性。
类型系统的运用
代码中使用了 TypeScript 来定义数据结构,这为大型项目的开发提供了强有力的类型保障。在跨平台开发中,类型系统的价值尤为突出——它可以在编译阶段发现潜在的类型错误,减少运行时异常,提升代码的健壮性。
type StatItem = {
  id: string;
  title: string;
  value: string | number;
  change: number;
  icon: string;
  color: string;
  period: string;
};
这种类型定义方式体现了领域驱动设计的思想。对于社交数据统计场景,我们需要准确把握每个数据实体的结构特征。在鸿蒙开发中,虽然 ArkTS 本身具备静态类型检查能力,但在与 React Native 混合开发时,TypeScript 的类型定义可以作为中间契约,确保两端数据模型的一致性。
响应式数据流设计
React Hooks 的引入彻底改变了 React 组件的状态管理方式。useState 钩子在这里被用于管理三种核心数据:统计卡片数据、活跃度趋势数据以及增长趋势数据。这种声明式的状态管理方式使得数据流清晰可控。
const [stats] = useState<StatItem[]>([
  { id: '1', title: '总好友数', value: 124, change: 12, icon: ICONS.user, color: '#3b82f6', period: '本月' },
  // ...
]);
在跨平台场景下,这种状态管理策略可以有效减少平台差异带来的复杂度。无论是 Android、iOS 还是鸿蒙,状态的变化都会触发相同的渲染逻辑,开发者只需关注数据的处理逻辑,而无需过多担心平台底层的渲染差异。
图表组件的可复用设计
代码中展示了两种图表组件的实现:ActivityTrendChart 和 GrowthChart。虽然两者功能不同(分别展示活跃度趋势和好友增长趋势),但其底层架构高度一致,体现了良好的工程实践。
const GrowthChart = ({ data }: { data: GrowthData[] }) => {
  const maxValue = Math.max(...data.map(item => item.value), 10);

  return (
    <View style={styles.chartContainer}>
      <Text style={styles.chartTitle}>好友增长趋势</Text>
      <View style={styles.chart}>
        {data.map((item, index) => (
          <View key={index} style={styles.chartItem}>
            <Text style={styles.chartDay}>{item.month}</Text>
            <View style={styles.chartBar}>
              <View
                style={[
                  styles.chartFill,
                  {
                    height: `${(item.value / maxValue) * 100}%`,
                    backgroundColor: '#10b981'
                  }
                ]}
              />
            </View>
            <Text style={styles.chartValue}>{item.value}</Text>
          </View>
        ))}
      </View>
    </View>
  );
};
在鸿蒙平台上实现类似的图表功能时,可以借鉴这种组件抽象思路。通过定义统一的图表配置接口,结合不同平台的渲染能力,可以构建一套跨平台的图表组件库。
跨平台布局策略
Dimensions API 的使用体现了响应式设计的理念。通过获取屏幕宽度并动态计算组件尺寸,应用能够自适应不同的设备屏幕。
const { width } = Dimensions.get('window');

// 在样式中使用
width: (width - 48) / 2,
这种技术在鸿蒙开发中同样重要。鸿蒙系统运行在多种形态的设备上,从手机到平板再到智慧屏,响应式布局是确保应用良好用户体验的关键。React Native 的跨平台布局系统(基于 Flexbox)与鸿蒙的 ArkUI 在核心理念上相似,这为技术迁移提供了一定的便利性。
状态更新的函数式设计
虽然当前代码中的数据是静态的,但刷新按钮的事件处理展示了状态更新的典型模式:
const refreshStats = () => {
  Alert.alert('刷新数据', '正在更新统计数据...');
};
在真实场景中,这里通常会调用数据请求接口,结合 useEffect 钩子来处理异步数据加载。React Query 或 SWR 等状态管理库可以与 React Native 无缝集成,为鸿蒙平台的数据层提供一致的管理方案。
组件通信与数据传递
代码展示了两种常见的组件通信模式:父组件向子组件传递数据(通过 props),以及用户交互事件从子组件向上传递(通过回调函数)。这种单向数据流的设计符合 React 的核心理念,使得应用的状态可预测、可追溯。
真实演示案例代码:
// app.tsx
import React, { useState } from 'react';
import { SafeAreaView, View, Text, StyleSheet, TouchableOpacity, ScrollView, Dimensions, Alert, FlatList } from 'react-native';
// 图标库
const ICONS = {
user: '👤',
trend: '📈',
growth: '🌱',
activity: '⚡',
message: '💬',
like: '👍',
share: '🔗',
calendar: '📅',
};
const { width } = Dimensions.get('window');
// 统计数据类型
type StatItem = {
id: string;
title: string;
value: string | number;
change: number;
icon: string;
color: string;
period: string;
};
// 活跃度趋势类型
type ActivityTrend = {
day: string;
value: number;
};
// 数据增长类型
type GrowthData = {
month: string;
value: number;
};
// 统计卡片组件
const StatCard = ({
title,
value,
change,
icon,
color
}: {
title: string;
value: string | number;
change: number;
icon: string;
color: string
}) => {
return (
<View style={styles.statCard}>
<View style={styles.cardHeader}>
<View style={[styles.iconContainer, { backgroundColor: `${color}20` }]}>
<Text style={[styles.iconText, { color }]}>{icon}</Text>
</View>
<Text style={styles.statTitle}>{title}</Text>
</View>
<View style={styles.cardBody}>
<Text style={styles.statValue}>{value}</Text>
<Text style={[styles.statChange, { color: change >= 0 ? '#10b981' : '#ef4444' }]}>
{change >= 0 ? '↑' : '↓'} {Math.abs(change)}%
</Text>
</View>
</View>
);
};
// 活跃度趋势组件
const ActivityTrendChart = ({ data }: { data: ActivityTrend[] }) => {
const maxValue = Math.max(...data.map(item => item.value), 10);
return (
<View style={styles.chartContainer}>
<Text style={styles.chartTitle}>活跃度趋势</Text>
<View style={styles.chart}>
{data.map((item, index) => (
<View key={index} style={styles.chartItem}>
<Text style={styles.chartDay}>{item.day}</Text>
<View style={styles.chartBar}>
<View
style={[
styles.chartFill,
{
height: `${(item.value / maxValue) * 100}%`,
backgroundColor: '#3b82f6'
}
]}
/>
</View>
<Text style={styles.chartValue}>{item.value}</Text>
</View>
))}
</View>
</View>
);
};
// 增长趋势组件
const GrowthChart = ({ data }: { data: GrowthData[] }) => {
const maxValue = Math.max(...data.map(item => item.value), 10);
return (
<View style={styles.chartContainer}>
<Text style={styles.chartTitle}>好友增长趋势</Text>
<View style={styles.chart}>
{data.map((item, index) => (
<View key={index} style={styles.chartItem}>
<Text style={styles.chartDay}>{item.month}</Text>
<View style={styles.chartBar}>
<View
style={[
styles.chartFill,
{
height: `${(item.value / maxValue) * 100}%`,
backgroundColor: '#10b981'
}
]}
/>
</View>
<Text style={styles.chartValue}>{item.value}</Text>
</View>
))}
</View>
</View>
);
};
// 数据项组件
const DataItem = ({
title,
value,
change
}: {
title: string;
value: string | number;
change: number
}) => {
return (
<View style={styles.dataItem}>
<Text style={styles.dataTitle}>{title}</Text>
<View style={styles.dataValueContainer}>
<Text style={styles.dataValue}>{value}</Text>
<Text style={[styles.dataChange, { color: change >= 0 ? '#10b981' : '#ef4444' }]}>
{change >= 0 ? '+' : ''}{change}%
</Text>
</View>
</View>
);
};
// 主页面组件
const SocialDataStatisticsApp: React.FC = () => {
const [stats] = useState<StatItem[]>([
{ id: '1', title: '总好友数', value: 124, change: 12, icon: ICONS.user, color: '#3b82f6', period: '本月' },
{ id: '2', title: '月活跃用户', value: 89, change: 5, icon: ICONS.activity, color: '#10b981', period: '本月' },
{ id: '3', title: '新增好友', value: 18, change: 25, icon: ICONS.growth, color: '#f59e0b', period: '本月' },
{ id: '4', title: '消息发送量', value: 342, change: -3, icon: ICONS.message, color: '#8b5cf6', period: '本月' },
{ id: '5', title: '获赞数', value: 156, change: 18, icon: ICONS.like, color: '#ec4899', period: '本月' },
{ id: '6', title: '分享次数', value: 42, change: 8, icon: ICONS.share, color: '#f97316', period: '本月' },
]);
const [activityTrend] = useState<ActivityTrend[]>([
{ day: '周一', value: 85 },
{ day: '周二', value: 92 },
{ day: '周三', value: 78 },
{ day: '周四', value: 88 },
{ day: '周五', value: 95 },
{ day: '周六', value: 76 },
{ day: '周日', value: 68 },
]);
const [growthData] = useState<GrowthData[]>([
{ month: '1月', value: 12 },
{ month: '2月', value: 18 },
{ month: '3月', value: 15 },
{ month: '4月', value: 22 },
{ month: '5月', value: 26 },
{ month: '6月', value: 30 },
]);
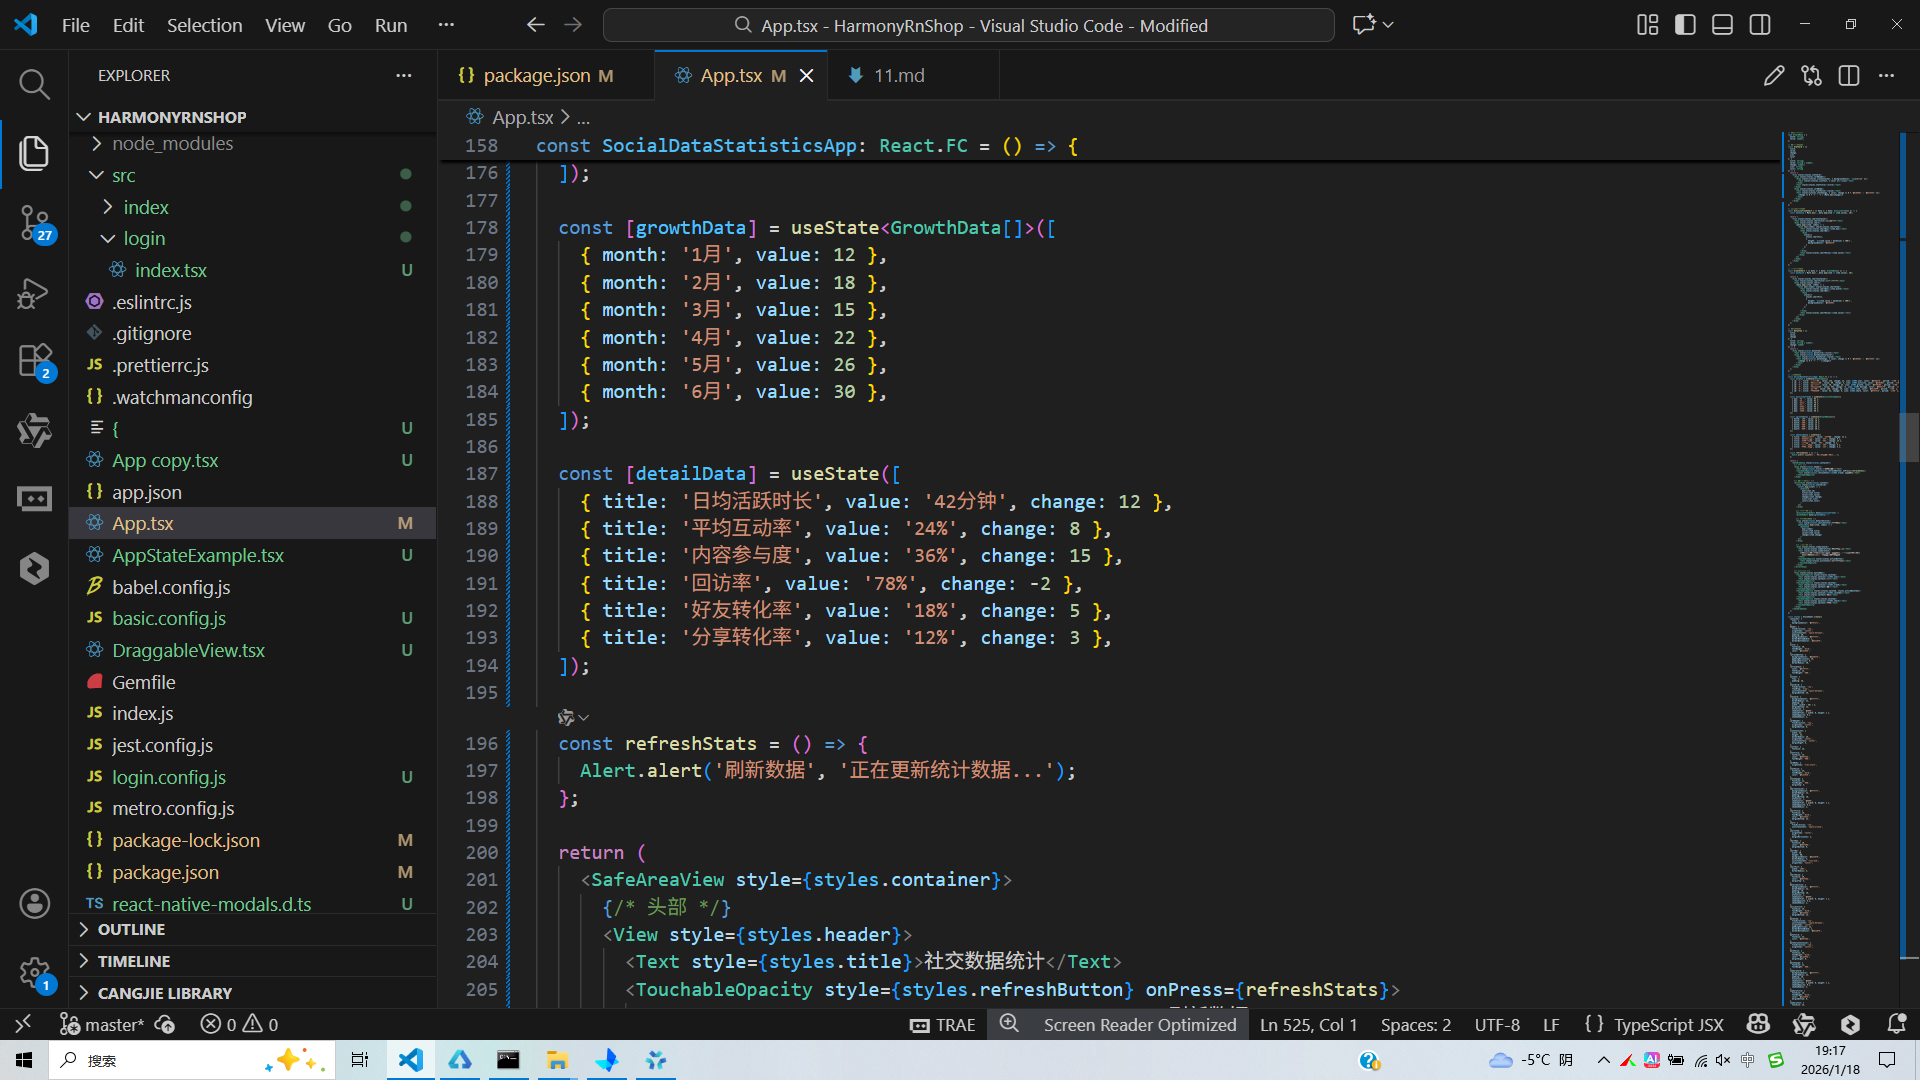
const [detailData] = useState([
{ title: '日均活跃时长', value: '42分钟', change: 12 },
{ title: '平均互动率', value: '24%', change: 8 },
{ title: '内容参与度', value: '36%', change: 15 },
{ title: '回访率', value: '78%', change: -2 },
{ title: '好友转化率', value: '18%', change: 5 },
{ title: '分享转化率', value: '12%', change: 3 },
]);
const refreshStats = () => {
Alert.alert('刷新数据', '正在更新统计数据...');
};
return (
<SafeAreaView style={styles.container}>
{/* 头部 */}
<View style={styles.header}>
<Text style={styles.title}>社交数据统计</Text>
<TouchableOpacity style={styles.refreshButton} onPress={refreshStats}>
<Text style={styles.refreshText}>{ICONS.trend} 刷新数据</Text>
</TouchableOpacity>
</View>
{/* 统计卡片网格 */}
<ScrollView style={styles.content}>
<View style={styles.statsGrid}>
{stats.map((stat) => (
<StatCard
key={stat.id}
title={stat.title}
value={stat.value}
change={stat.change}
icon={stat.icon}
color={stat.color}
/>
))}
</View>
{/* 趋势图表 */}
<ActivityTrendChart data={activityTrend} />
<GrowthChart data={growthData} />
{/* 详细数据列表 */}
<View style={styles.detailSection}>
<Text style={styles.sectionTitle}>详细数据</Text>
{detailData.map((item, index) => (
<DataItem
key={index}
title={item.title}
value={item.value}
change={item.change}
/>
))}
</View>
{/* 总结卡片 */}
<View style={styles.summaryCard}>
<Text style={styles.summaryTitle}>数据分析总结</Text>
<Text style={styles.summaryText}>
本月活跃用户增长稳定,互动率有所提升。建议继续保持内容质量,
加强与用户的互动,进一步提升用户留存率。
</Text>
<TouchableOpacity style={styles.actionButton}>
<Text style={styles.actionText}>查看详细报告</Text>
</TouchableOpacity>
</View>
</ScrollView>
{/* 底部导航 */}
<View style={styles.bottomNav}>
<TouchableOpacity style={styles.navItem}>
<Text style={styles.navIcon}>{ICONS.user}</Text>
<Text style={styles.navText}>好友</Text>
</TouchableOpacity>
<TouchableOpacity style={styles.navItem}>
<Text style={styles.navIcon}>{ICONS.trend}</Text>
<Text style={styles.navText}>统计</Text>
</TouchableOpacity>
<TouchableOpacity style={[styles.navItem, styles.activeNavItem]}>
<Text style={styles.navIcon}>{ICONS.calendar}</Text>
<Text style={styles.navText}>数据</Text>
</TouchableOpacity>
<TouchableOpacity style={styles.navItem}>
<Text style={styles.navIcon}>{ICONS.share}</Text>
<Text style={styles.navText}>分享</Text>
</TouchableOpacity>
</View>
</SafeAreaView>
);
};
const styles = StyleSheet.create({
container: {
flex: 1,
backgroundColor: '#f8fafc',
},
header: {
flexDirection: 'row',
alignItems: 'center',
justifyContent: 'space-between',
padding: 20,
backgroundColor: '#ffffff',
borderBottomWidth: 1,
borderBottomColor: '#e2e8f0',
},
title: {
fontSize: 20,
fontWeight: 'bold',
color: '#1e293b',
},
refreshButton: {
backgroundColor: '#3b82f6',
paddingHorizontal: 16,
paddingVertical: 8,
borderRadius: 20,
},
refreshText: {
color: '#ffffff',
fontSize: 14,
fontWeight: '500',
},
content: {
flex: 1,
padding: 16,
},
statsGrid: {
flexDirection: 'row',
flexWrap: 'wrap',
justifyContent: 'space-between',
marginBottom: 16,
},
statCard: {
backgroundColor: '#ffffff',
borderRadius: 12,
padding: 16,
width: (width - 48) / 2,
marginBottom: 12,
elevation: 1,
shadowColor: '#000',
shadowOffset: { width: 0, height: 1 },
shadowOpacity: 0.1,
shadowRadius: 2,
},
cardHeader: {
flexDirection: 'row',
alignItems: 'center',
marginBottom: 8,
},
iconContainer: {
width: 32,
height: 32,
borderRadius: 16,
alignItems: 'center',
justifyContent: 'center',
marginRight: 8,
},
iconText: {
fontSize: 16,
},
statTitle: {
fontSize: 14,
color: '#64748b',
fontWeight: '500',
},
cardBody: {
alignItems: 'flex-start',
},
statValue: {
fontSize: 24,
fontWeight: 'bold',
color: '#1e293b',
},
statChange: {
fontSize: 12,
fontWeight: '500',
marginTop: 4,
},
chartContainer: {
backgroundColor: '#ffffff',
borderRadius: 12,
padding: 16,
marginBottom: 16,
elevation: 1,
shadowColor: '#000',
shadowOffset: { width: 0, height: 1 },
shadowOpacity: 0.1,
shadowRadius: 2,
},
chartTitle: {
fontSize: 16,
fontWeight: 'bold',
color: '#1e293b',
marginBottom: 12,
},
chart: {
flexDirection: 'row',
justifyContent: 'space-around',
},
chartItem: {
alignItems: 'center',
flex: 1,
marginHorizontal: 2,
},
chartDay: {
fontSize: 10,
color: '#64748b',
marginBottom: 8,
},
chartBar: {
width: 20,
height: 80,
backgroundColor: '#e2e8f0',
borderRadius: 4,
justifyContent: 'flex-end',
alignItems: 'center',
},
chartFill: {
width: '100%',
borderRadius: 4,
},
chartValue: {
fontSize: 10,
color: '#64748b',
marginTop: 4,
},
detailSection: {
backgroundColor: '#ffffff',
borderRadius: 12,
padding: 16,
marginBottom: 16,
elevation: 1,
shadowColor: '#000',
shadowOffset: { width: 0, height: 1 },
shadowOpacity: 0.1,
shadowRadius: 2,
},
sectionTitle: {
fontSize: 18,
fontWeight: 'bold',
color: '#1e293b',
marginBottom: 12,
},
dataItem: {
flexDirection: 'row',
justifyContent: 'space-between',
alignItems: 'center',
paddingVertical: 12,
borderBottomWidth: 1,
borderBottomColor: '#e2e8f0',
},
dataTitle: {
fontSize: 14,
color: '#64748b',
},
dataValueContainer: {
flexDirection: 'row',
alignItems: 'center',
},
dataValue: {
fontSize: 16,
fontWeight: 'bold',
color: '#1e293b',
marginRight: 8,
},
dataChange: {
fontSize: 12,
fontWeight: '500',
},
summaryCard: {
backgroundColor: '#ffffff',
borderRadius: 12,
padding: 16,
elevation: 1,
shadowColor: '#000',
shadowOffset: { width: 0, height: 1 },
shadowOpacity: 0.1,
shadowRadius: 2,
},
summaryTitle: {
fontSize: 16,
fontWeight: 'bold',
color: '#1e293b',
marginBottom: 8,
},
summaryText: {
fontSize: 14,
color: '#64748b',
lineHeight: 20,
marginBottom: 16,
},
actionButton: {
backgroundColor: '#3b82f6',
paddingVertical: 10,
borderRadius: 8,
alignItems: 'center',
},
actionText: {
color: '#ffffff',
fontWeight: '500',
},
bottomNav: {
flexDirection: 'row',
justifyContent: 'space-around',
backgroundColor: '#ffffff',
borderTopWidth: 1,
borderTopColor: '#e2e8f0',
paddingVertical: 12,
},
navItem: {
alignItems: 'center',
flex: 1,
},
activeNavItem: {
paddingBottom: 2,
borderBottomWidth: 2,
borderBottomColor: '#3b82f6',
},
navIcon: {
fontSize: 20,
color: '#94a3b8',
marginBottom: 4,
},
activeNavIcon: {
color: '#3b82f6',
},
navText: {
fontSize: 12,
color: '#94a3b8',
},
activeNavText: {
color: '#3b82f6',
fontWeight: '500',
},
});
export default SocialDataStatisticsApp;
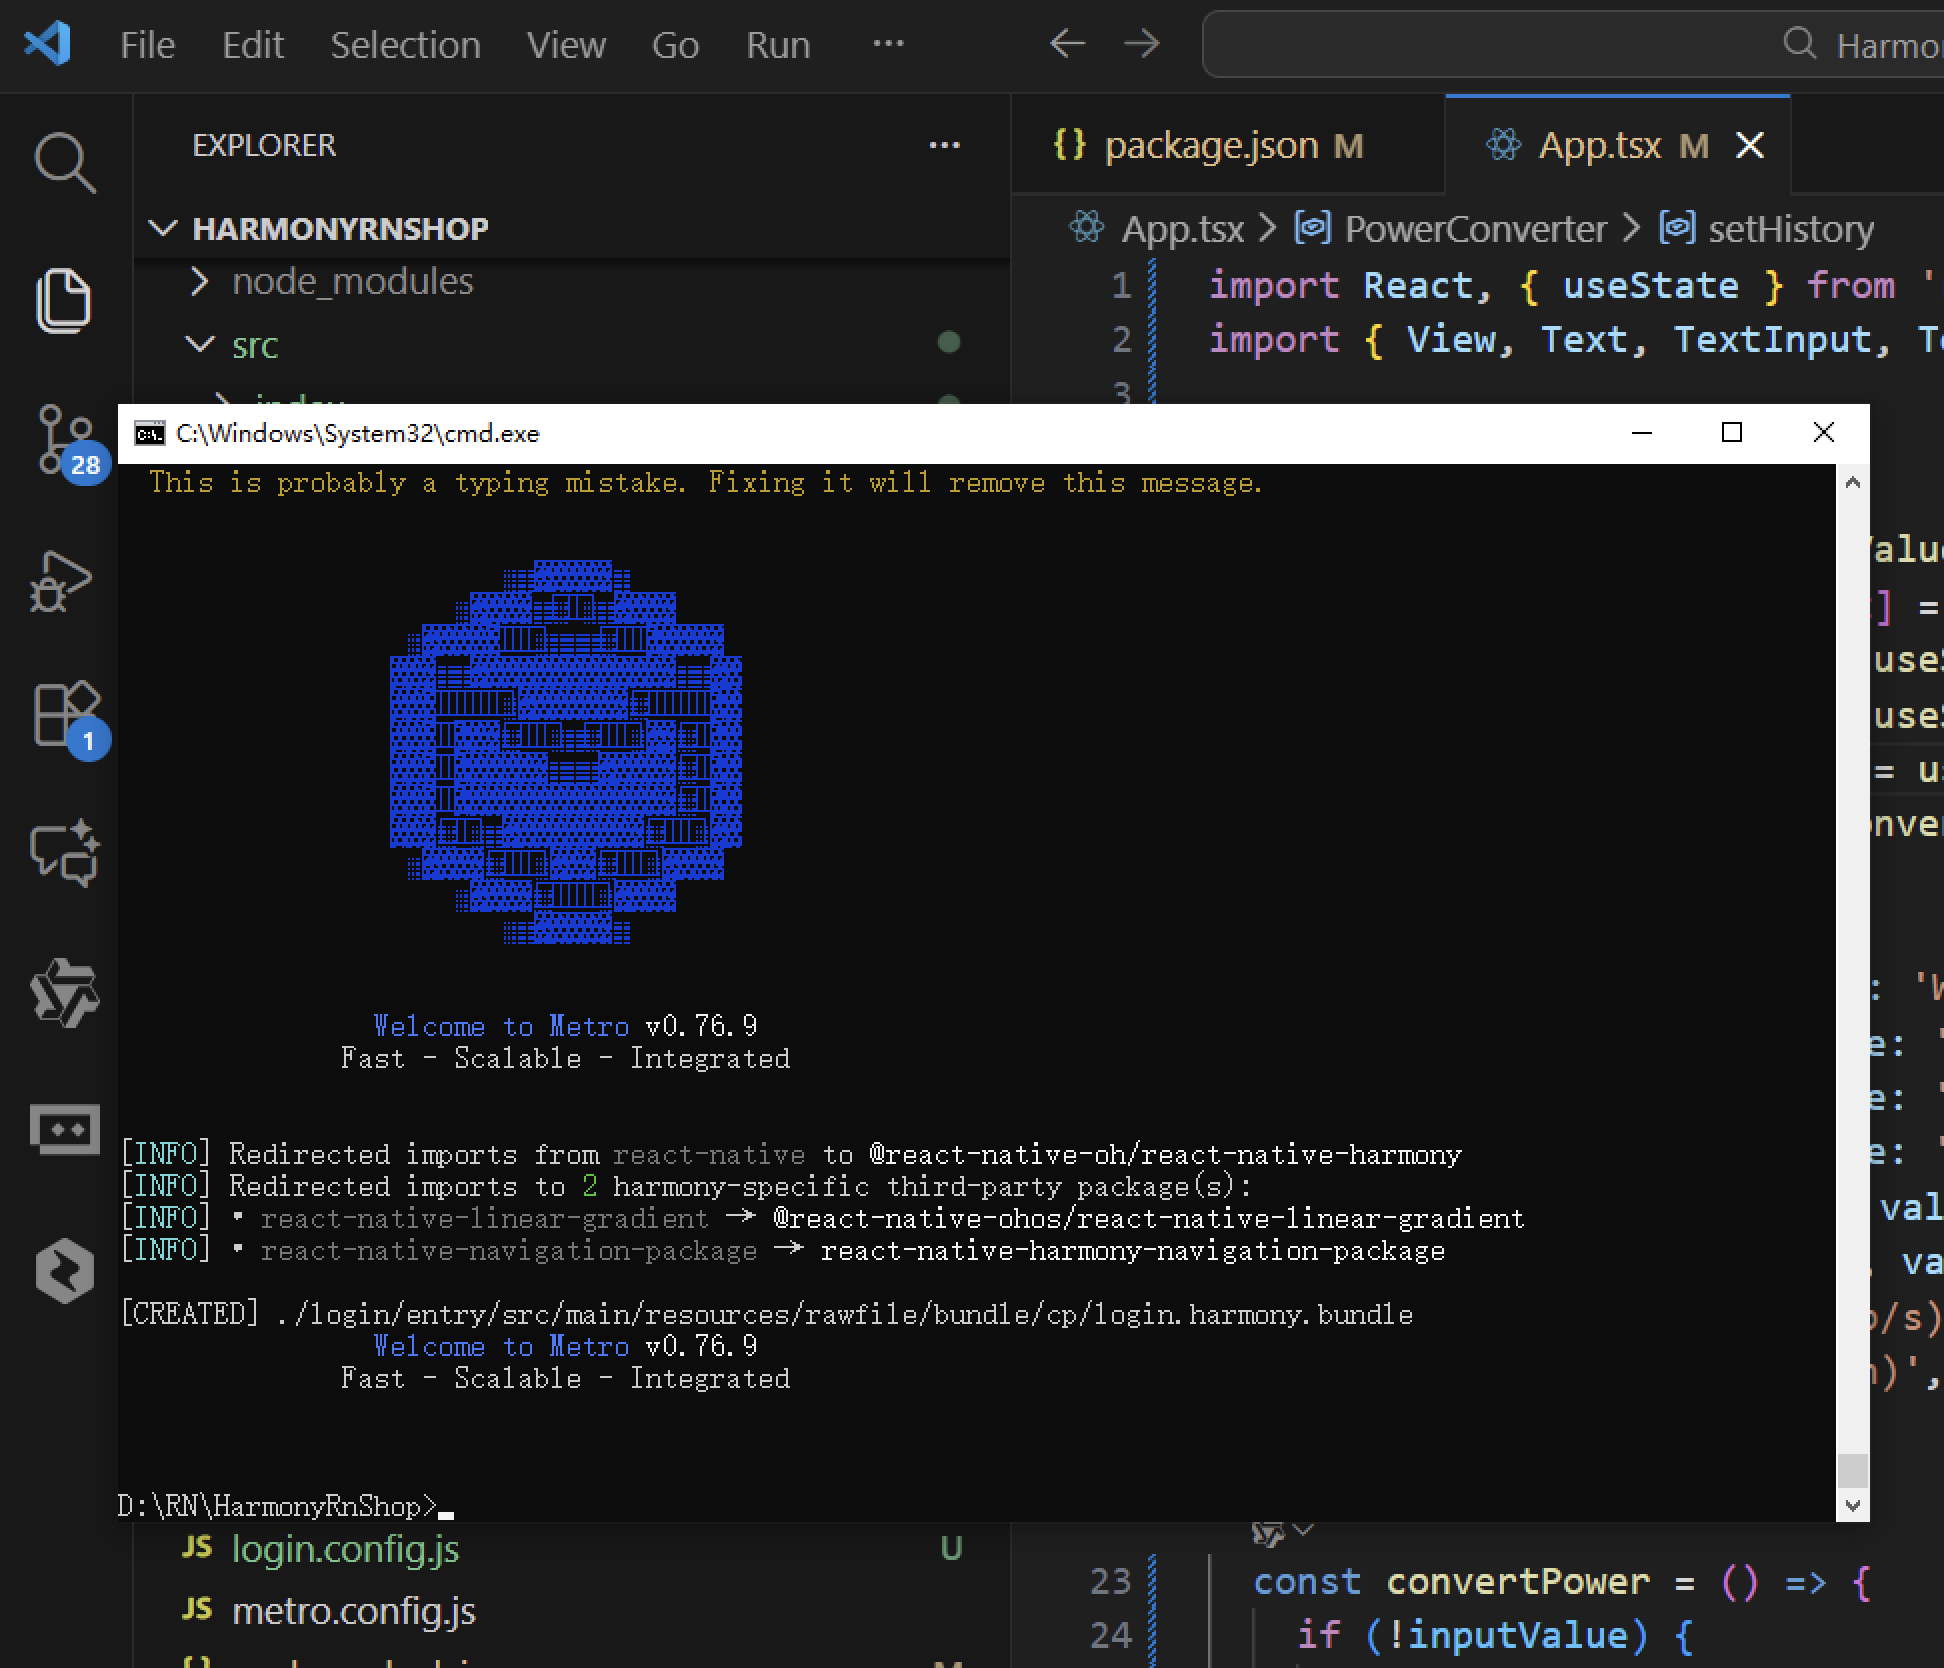
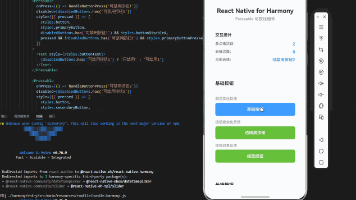
打包
接下来通过打包命令npn run harmony将reactNative的代码打包成为bundle,这样可以进行在开源鸿蒙OpenHarmony中进行使用。
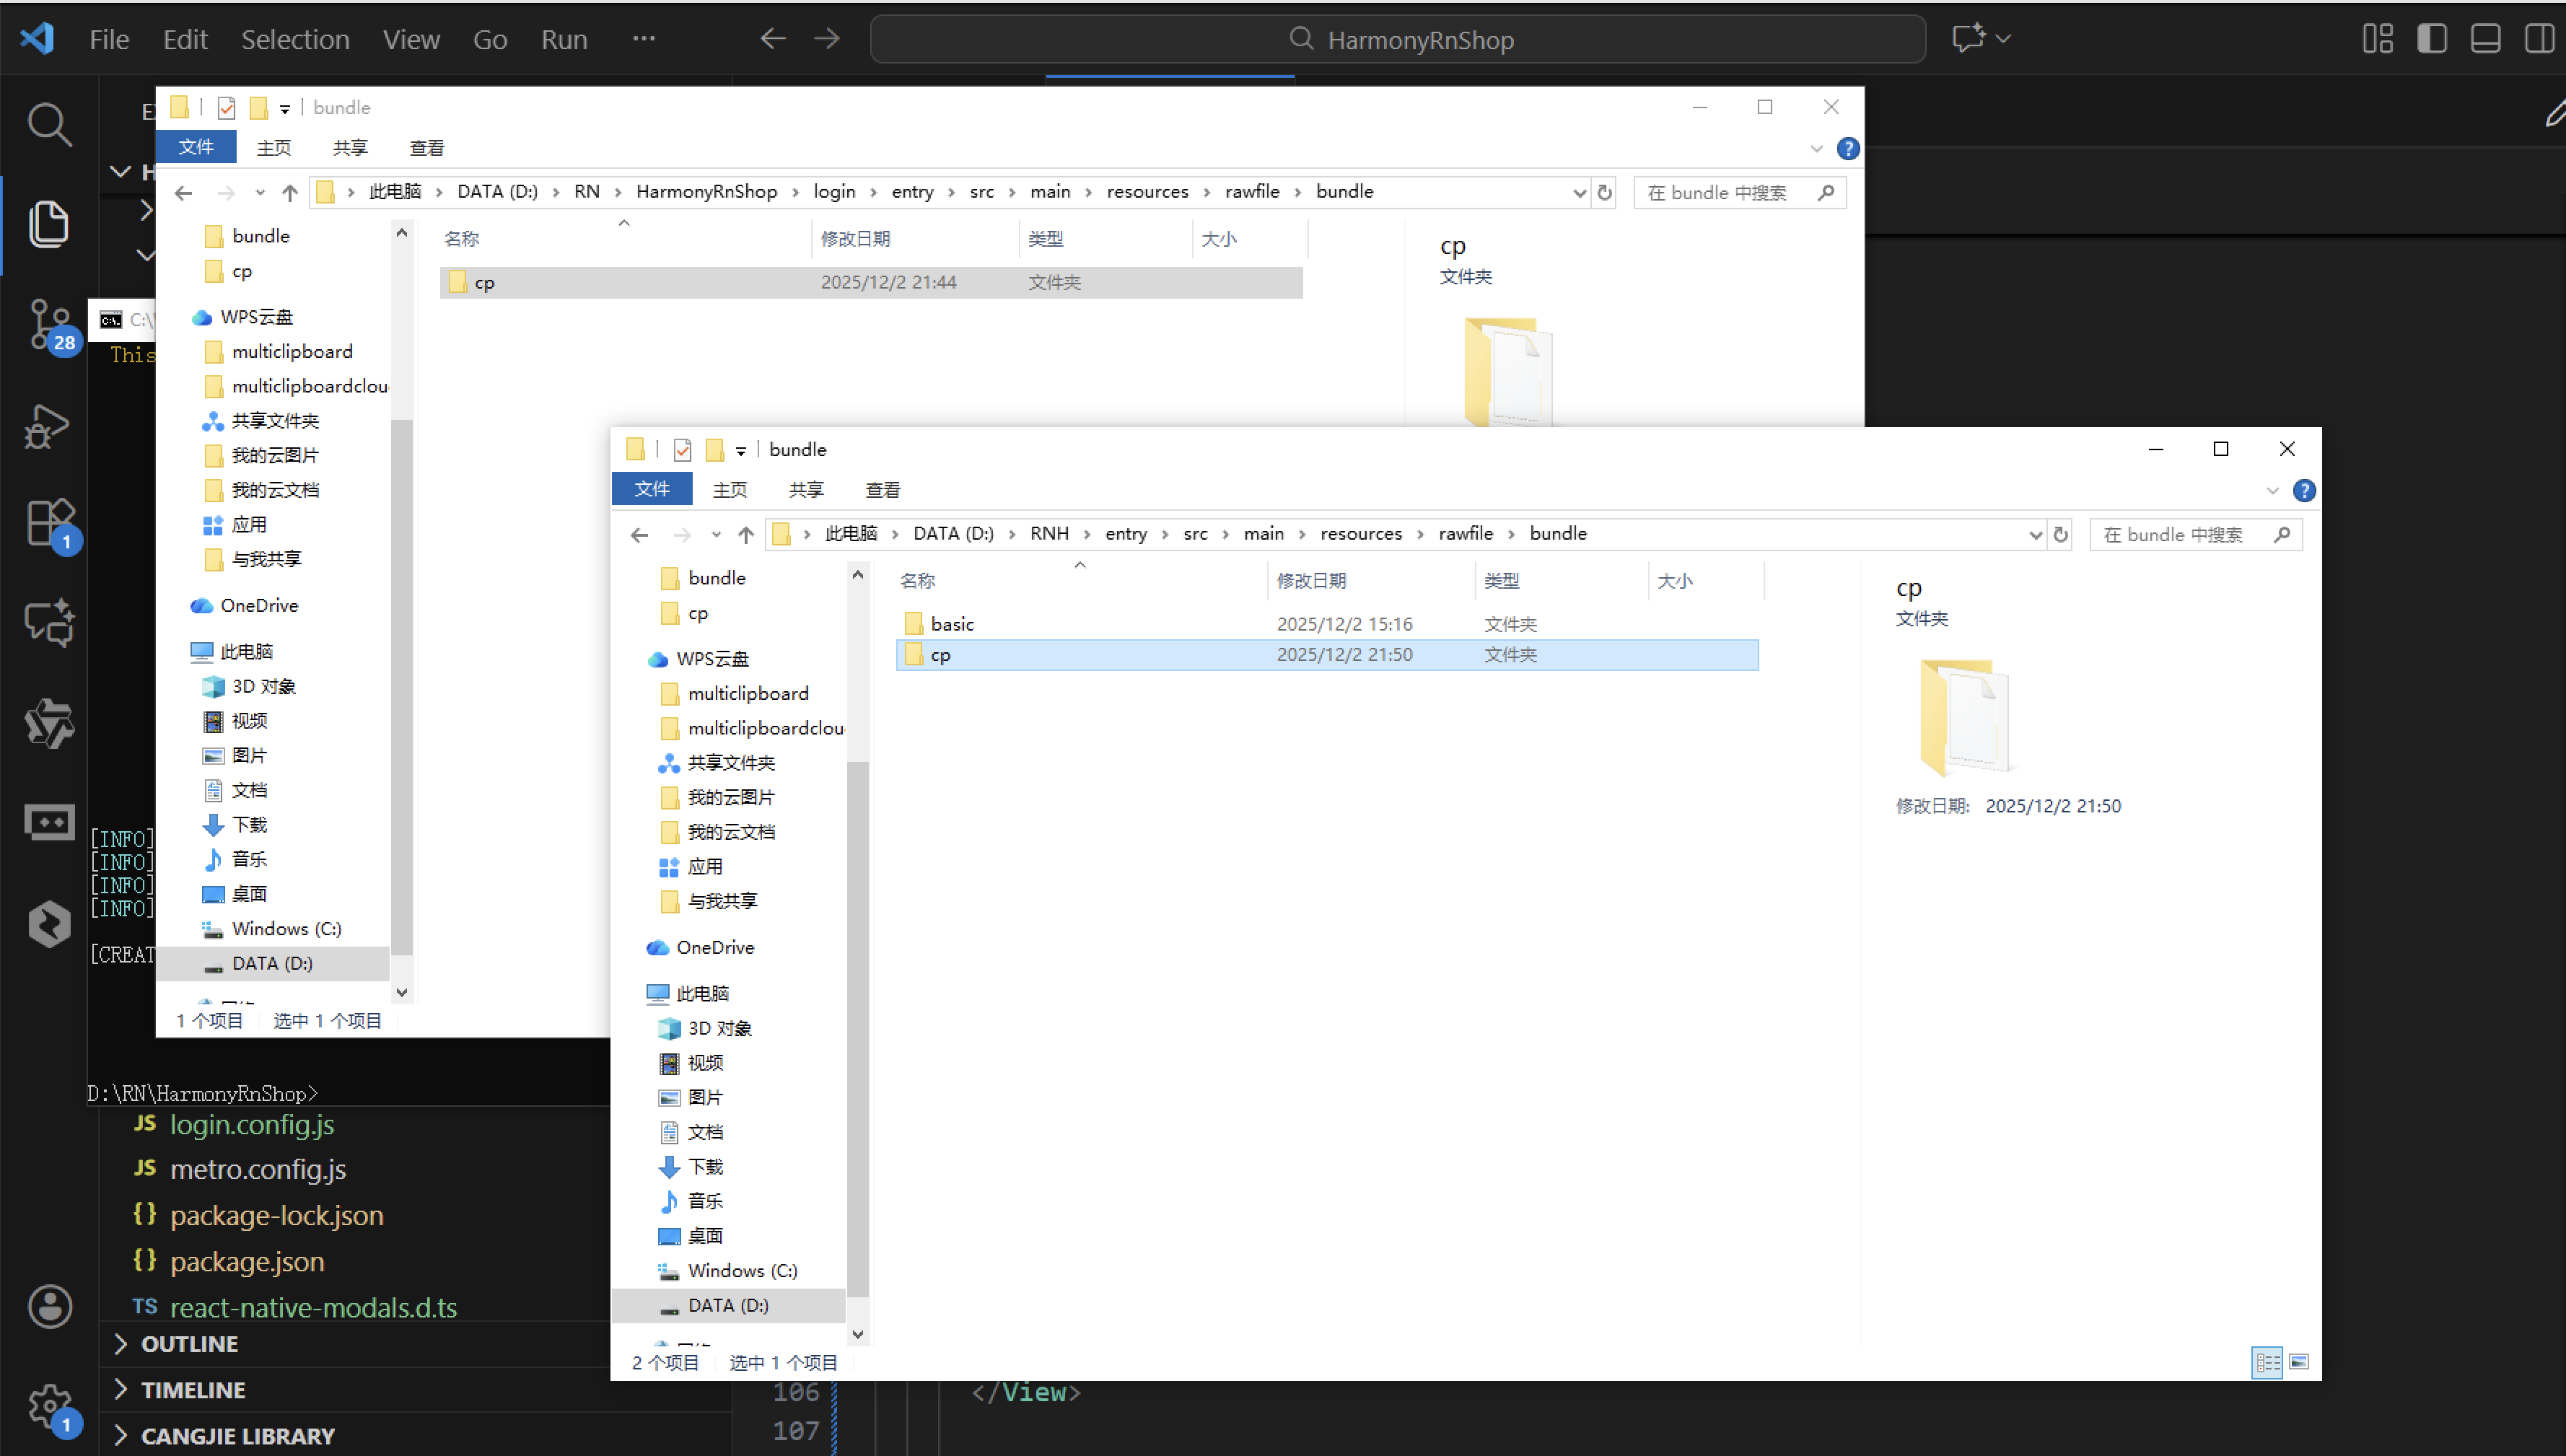
打包之后再将打包后的鸿蒙OpenHarmony文件拷贝到鸿蒙的DevEco-Studio工程目录去:
最后运行效果图如下显示:
欢迎大家加入开源鸿蒙跨平台开发者社区,一起共建开源鸿蒙跨平台生态。

讨论HarmonyOS开发技术,专注于API与组件、DevEco Studio、测试、元服务和应用上架分发等。
更多推荐

 9
9 0
0- 0


 已为社区贡献3条内容

所有评论(0)