[理财有道应用]Flutter × HarmonyOS 6.0 跨端开发
本文介绍了基于Flutter和HarmonyOS 6.0开发的跨端理财应用"理财有道"的统计模块实现方案。该应用通过Flutter的Widget树实现统一UI构建,利用HarmonyOS的跨设备特性,实现一次开发多端运行。核心功能包括总收入/支出统计、结余计算和支出分类图表展示,采用GridView构建统计卡片网格,并通过动态颜色切换增强可读性。文章分享了Flutter与Har
[理财有道应用]Flutter × HarmonyOS 6.0 跨端开发
前言
在现代生活中,个人理财已成为人们关注的重要话题。无论是学生、白领还是自由职业者,科学管理收入与支出、及时了解财务状况都是必要技能。为了帮助用户高效管理财务,我们开发了跨端应用 “理财有道”,它基于 Flutter × HarmonyOS 6.0 构建,支持多端运行,同时提供强大的统计分析功能,让用户可以一目了然地掌握财务动态。
在本文中,我将分享 “理财有道” 的统计信息模块实现方案,包括核心代码解析、开发心得与总结,希望对 Flutter 和 HarmonyOS 跨端开发爱好者有所启发。
背景
在开发个人理财应用时,我们面临几个挑战:
- 跨端适配需求:HarmonyOS 6.0 支持多设备运行,如手机、平板、智能屏等,应用需在不同分辨率和屏幕尺寸下保持良好体验。
- 数据可视化要求高:用户不仅希望看到总收支,还希望通过图表直观了解支出分类。
- UI 体验一致性:不同平台对字体、间距、卡片样式有差异,需要在跨端框架中统一设计风格。
Flutter 提供了统一的 UI 构建方式,而 HarmonyOS 6.0 的跨端特性则让我们可以一次开发、多端运行,实现低成本高复用。
Flutter × HarmonyOS 6.0 跨端开发介绍
Flutter 是 Google 提供的跨平台 UI 框架,以 Widget 树 为核心思想,能够快速构建高性能、流畅的界面。HarmonyOS 6.0 引入了 ArkUI 与 Ability Framework,支持跨设备应用开发,通过 FA/FAF 组件在多设备间共享逻辑。
将 Flutter 与 HarmonyOS 结合,有以下优势:
- 统一 UI 构建:Flutter 的 Widget 树可在 HarmonyOS 端直接渲染。
- 代码复用率高:业务逻辑与数据层可直接共享,减少重复开发。
- 丰富插件生态:Flutter 社区提供大量第三方库,如图表绘制、状态管理等,可快速集成统计功能。
- 高性能渲染:通过 Skia 引擎实现 GPU 加速,确保流畅交互。
因此,Flutter × HarmonyOS 是跨端个人理财应用的理想选择。

开发核心代码
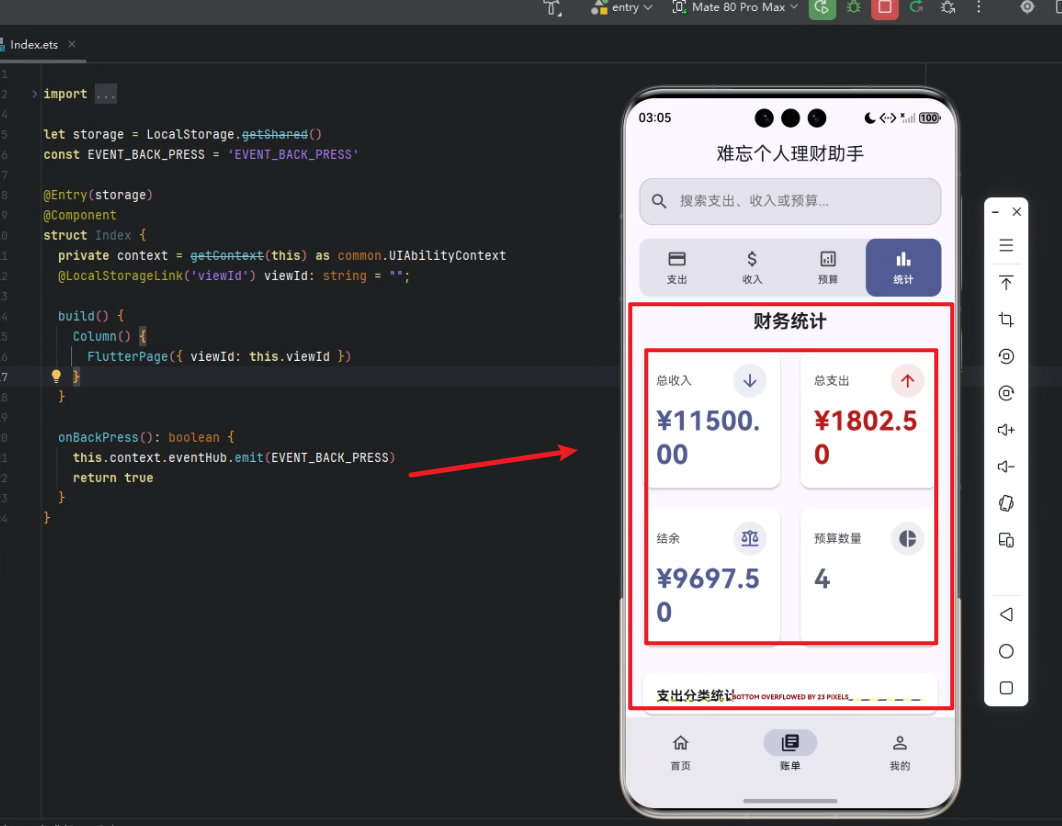
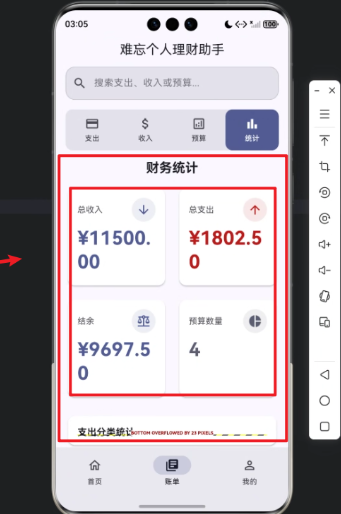
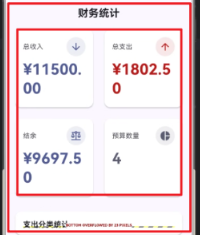
统计信息模块是 “理财有道” 的核心功能之一,主要分为 总收支统计、结余计算、预算统计 和 支出分类图表 四部分。
以下是核心实现代码及解析。
1. 构建统计信息模块
Widget _buildStatisticsModule(ThemeData theme) {
  // 计算总收入和总支出
  final totalIncome = _income.fold(0.0, (sum, item) => sum + item.amount);
  final totalExpense = _expenses.fold(0.0, (sum, item) => sum + item.amount);
  final balance = totalIncome - totalExpense;

  return Column(
    children: [
      Padding(
        padding: const EdgeInsets.symmetric(horizontal: 16),
        child: Text(
          '财务统计',
          style: theme.textTheme.titleLarge?.copyWith(fontWeight: FontWeight.bold),
        ),
      ),
      const SizedBox(height: 16),
      Padding(
        padding: const EdgeInsets.symmetric(horizontal: 16),
        child: GridView.count(
          crossAxisCount: 2,
          mainAxisSpacing: 16,
          crossAxisSpacing: 16,
          shrinkWrap: true,
          physics: const NeverScrollableScrollPhysics(),
          children: [
            _buildStatisticCard(
              title: '总收入',
              value: '¥${totalIncome.toStringAsFixed(2)}',
              icon: Icons.arrow_downward,
              color: theme.colorScheme.primary,
              theme: theme,
            ),
            _buildStatisticCard(
              title: '总支出',
              value: '¥${totalExpense.toStringAsFixed(2)}',
              icon: Icons.arrow_upward,
              color: theme.colorScheme.error,
              theme: theme,
            ),
            _buildStatisticCard(
              title: '结余',
              value: '¥${balance.toStringAsFixed(2)}',
              icon: Icons.balance,
              color: balance >= 0 ? theme.colorScheme.primary : theme.colorScheme.error,
              theme: theme,
            ),
            _buildStatisticCard(
              title: '预算数量',
              value: _budgets.length.toString(),
              icon: Icons.pie_chart,
              color: theme.colorScheme.secondary,
              theme: theme,
            ),
          ],
        ),
      ),
      const SizedBox(height: 24),
      Expanded(
        child: Padding(
          padding: const EdgeInsets.symmetric(horizontal: 16),
          child: Card(
            elevation: 2,
            shape: RoundedRectangleBorder(
              borderRadius: BorderRadius.circular(12),
            ),
            child: Padding(
              padding: const EdgeInsets.all(16),
              child: Column(
                crossAxisAlignment: CrossAxisAlignment.start,
                children: [
                  Text(
                    '支出分类统计',
                    style: theme.textTheme.titleMedium?.copyWith(
                      fontWeight: FontWeight.bold,
                    ),
                  ),
                  const SizedBox(height: 16),
                  Expanded(
                    child: _buildExpenseCategoryChart(theme),
                  ),
                ],
              ),
            ),
          ),
        ),
      ),
    ],
  );
}
解析:
_income.fold与_expenses.fold用于计算总收入和总支出,利用 Dart 的高阶函数实现聚合。GridView.count构建统计卡片网格,每行两列,便于视觉分布均匀。_buildStatisticCard用于封装单个统计卡片,保持样式一致,支持图标、颜色和数值动态绑定。- 结余显示根据正负值动态切换颜色,提高可读性。
- 支出分类通过图表显示,增强财务分析的直观性。
2. 构建统计卡片
Widget _buildStatisticCard({
  required String title,
  required String value,
  required IconData icon,
  required Color color,
  required ThemeData theme,
}) {
  return Card(
    elevation: 2,
    shape: RoundedRectangleBorder(
      borderRadius: BorderRadius.circular(12),
    ),
    child: Padding(
      padding: const EdgeInsets.all(16),
      child: Column(
        crossAxisAlignment: CrossAxisAlignment.start,
        children: [
          Row(
            mainAxisAlignment: MainAxisAlignment.spaceBetween,
            children: [
              Text(
                title,
                style: theme.textTheme.bodyMedium?.copyWith(
                  color: theme.colorScheme.onSurfaceVariant,
                ),
              ),
              Container(
                width: 40,
                height: 40,
                decoration: BoxDecoration(
                  shape: BoxShape.circle,
                  color: color.withOpacity(0.1),
                ),
                child: Center(
                  child: Icon(
                    icon,
                    size: 24,
                    color: color,
                  ),
                ),
              ),
            ],
          ),
          const SizedBox(height: 8),
          Text(
            value,
            style: theme.textTheme.headlineLarge?.copyWith(
              fontWeight: FontWeight.bold,
              color: color,
            ),
          ),
        ],
      ),
    ),
  );
}
解析:
- 卡片整体使用
Card+Padding包裹,实现立体效果与圆角。 - 顶部
Row布局,左侧显示标题,右侧圆形图标增强视觉引导。 - 金额值使用
headlineLarge样式并加粗,使数据醒目。 - 颜色动态传入,正收入、负支出、结余颜色区分明显。
3. 支出分类图表
模块中 _buildExpenseCategoryChart(theme) 用于绘制饼图或柱状图,依赖如 fl_chart 插件,可实现以下功能:
- 显示每类支出占比。
- 动态更新数据,实时反映用户操作。
- 配合卡片样式,整体视觉统一。
// 示例:饼图实现(简化)
Widget _buildExpenseCategoryChart(ThemeData theme) {
  return PieChart(
    PieChartData(
      sections: _expenseCategories.map((category) {
        return PieChartSectionData(
          value: category.amount,
          title: category.name,
          color: category.color,
          radius: 50,
          titleStyle: theme.textTheme.bodySmall?.copyWith(
            color: Colors.white,
            fontWeight: FontWeight.bold,
          ),
        );
      }).toList(),
    ),
  );
}
心得
- 统一风格:通过封装
_buildStatisticCard和图表组件,实现风格统一,便于后期扩展。 - 数据绑定简洁:利用 Dart 的高阶函数如
fold聚合数据,实现逻辑清晰。 - 跨端兼容:Flutter + HarmonyOS 的组合让应用在手机和平板上都能保持相同 UI,减少适配工作量。
- 可扩展性强:统计模块结构清晰,未来可以增加趋势图、历史记录分析等功能。
总结
通过 Flutter × HarmonyOS 6.0 构建的 “理财有道” 统计信息模块,实现了 总收支统计、结余显示、预算数量统计以及支出分类图表 的完整功能。模块采用网格布局 + 卡片 + 图表的组合方式,不仅美观,还提高了用户对财务状况的理解效率。
借助 Flutter 的跨端能力和 HarmonyOS 的多设备适配,应用在不同终端上保持一致体验,同时开发成本大幅降低。未来可以继续扩展 趋势分析、预算提醒、投资统计 等功能,让理财助手更智能、更贴近用户需求。

讨论HarmonyOS开发技术,专注于API与组件、DevEco Studio、测试、元服务和应用上架分发等。
更多推荐

 22
22 0
0- 0


 已为社区贡献242条内容

所有评论(0)