ReactNative for Harmony 项目鸿蒙化三方库集成实战:react-native-echarts-pro
📋 前言
react-native-echarts-pro 是 React Native 社区最强大的数据可视化图表库,基于 Apache ECharts 构建,提供了完整的图表绘制解决方案。它支持几乎所有 ECharts 图表类型,包括折线图、柱状图、饼图、散点图、雷达图、K线图、热力图、关系图等,并且完全兼容 Android、iOS、Web 和 HarmonyOS 多平台。
🎯 库简介
基本信息
- 库名称: react-native-echarts-pro
- 版本信息:
1.9.1: 支持 RN 0.72 版本1.9.3: 支持 RN 0.77 版本
- 官方仓库: https://github.com/supervons/react-native-echarts-pro
- 主要功能:
- 支持 20+ 种图表类型
- 支持 ECharts 所有配置项
- 支持多种主题样式
- 支持动态数据更新
- 支持事件交互
- 支持扩展插件(如词云、地图等)
- 兼容多平台
- 兼容性验证:
- RNOH: 0.72.27; SDK: HarmonyOS-Next-DB1 5.0.0.29(SP1); IDE: DevEco Studio 5.0.3.403; ROM: 3.0.0.25;
- RNOH: 0.72.33; SDK: OpenHarmony 5.0.0.71(API Version 12 Release); IDE: DevEco Studio 5.0.3.900; ROM: NEXT.0.0.71;
- RNOH: 0.77.18; SDK: HarmonyOS 5.1.1 Release; IDE: DevEco Studio 5.1.1.830; ROM: NEXT 5.1.0.150;
为什么需要这个库?
- 功能强大: 支持 20+ 种图表类型,满足各种数据可视化需求
- 配置灵活: 完全支持 ECharts 配置项,可定制化程度高
- 性能优异: 基于 WebView 渲染,性能表现优秀
- 跨平台: 在多平台提供一致的图表体验
- 易于使用: API 简单直观,上手容易
- 专业级: 数据分析、商业智能应用必备
📦 安装步骤
1. 使用 npm 安装
根据您的 RN 版本选择对应的版本:
# RN 0.72
npm install react-native-echarts-pro@^1.9.1

# RN 0.77
npm install react-native-echarts-pro@1.9.3
2. 验证安装
安装完成后,检查 package.json 文件,应该能看到新增的依赖:
{
  "dependencies": {
    "react-native-echarts-pro": "^1.9.1",
    // ... 其他依赖
  }
}
🔧 HarmonyOS 平台配置 ⭐
重要说明
react-native-echarts-pro 的 HarmonyOS 侧实现依赖 @react-native-oh-tpl/react-native-webview 的原生端代码。
如果已在 HarmonyOS 工程中引入过 react-native-webview,则无需再次引入,可跳过本章节步骤,直接使用。
如未引入 react-native-webview,请先按照以下步骤引入:
💻 完整代码示例
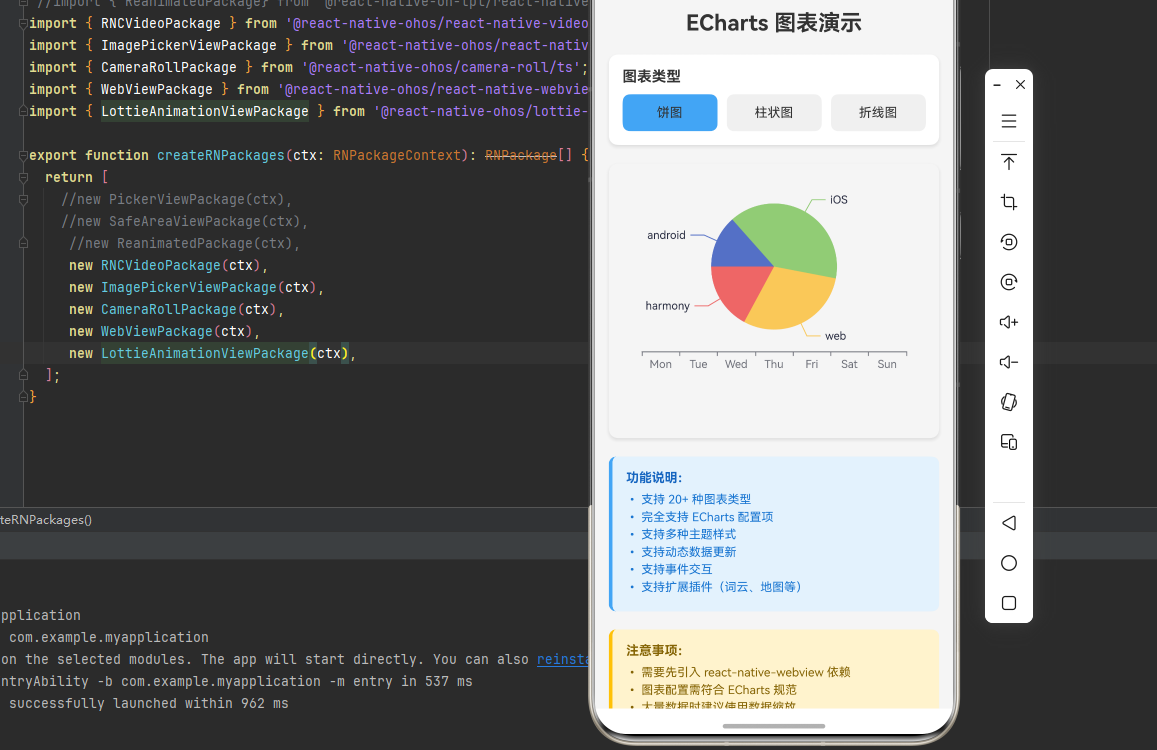
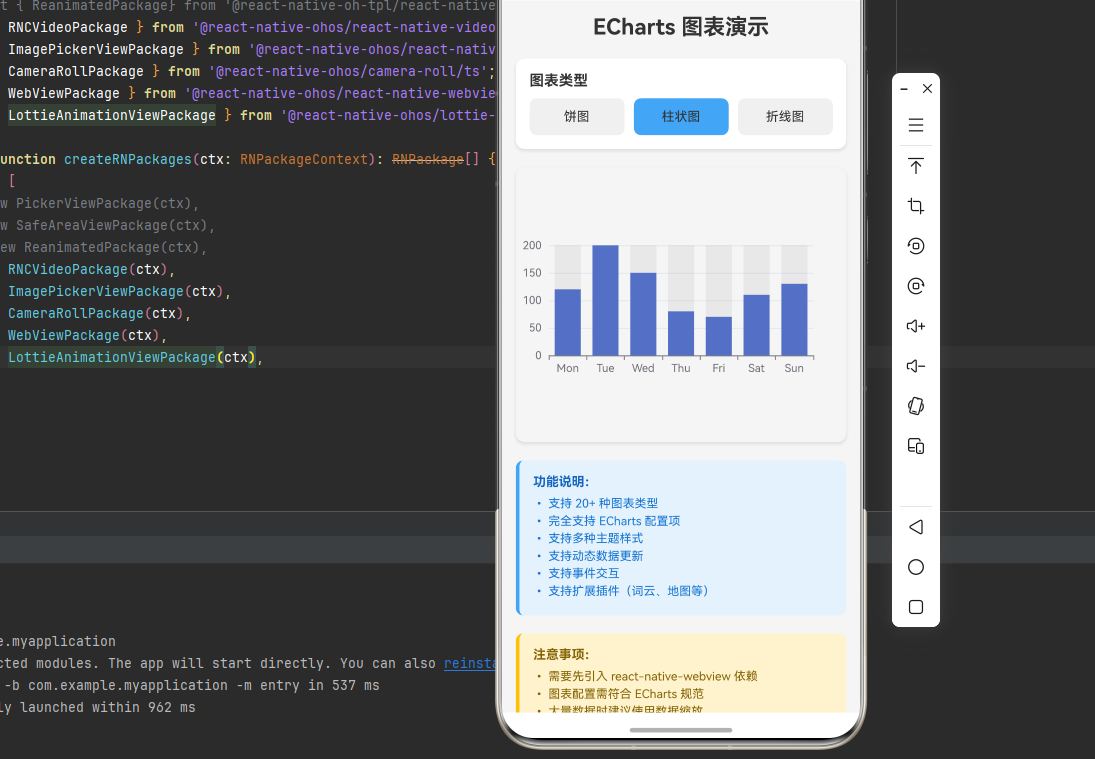
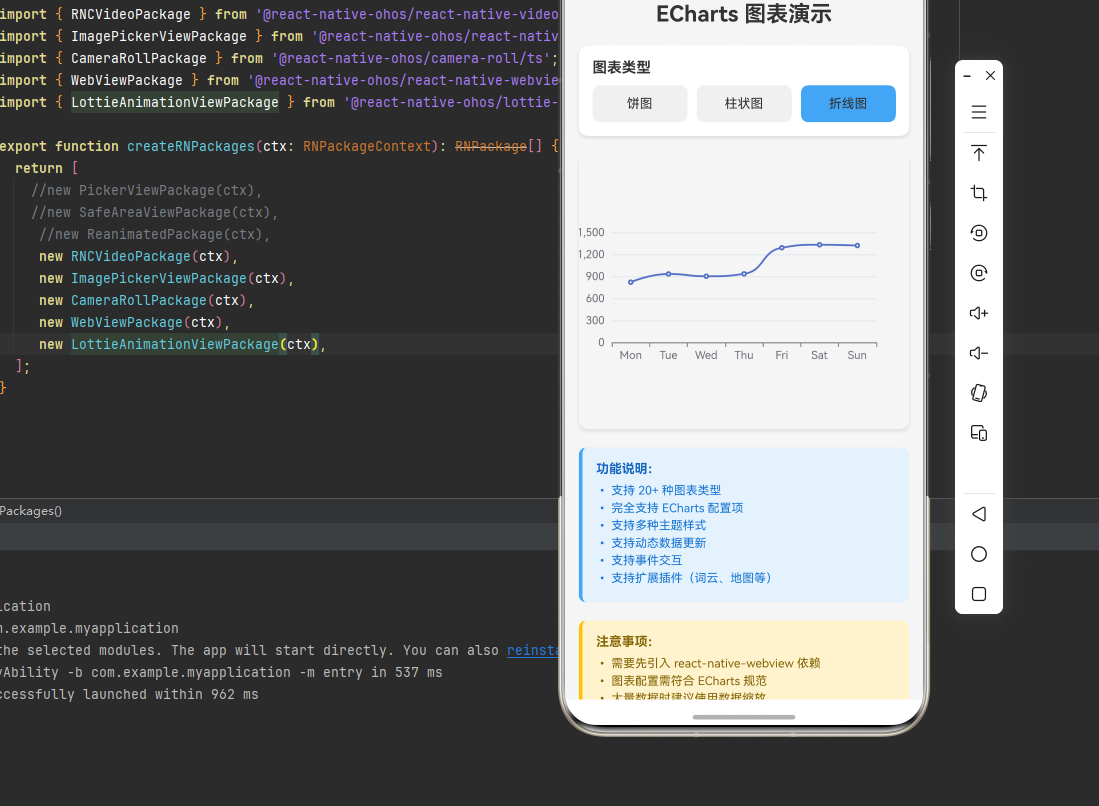
下面是一个完整的示例,展示了 react-native-echarts-pro 的各种使用场景:
import React, { useState } from 'react';
import {
  View,
  Text,
  StyleSheet,
  ScrollView,
  TouchableOpacity,
  SafeAreaView,
} from 'react-native';
import RNEChartsPro from 'react-native-echarts-pro';

function EChartsDemo() {
  const [chartType, setChartType] = useState<'pie' | 'bar' | 'line'>('pie');

  // 饼图配置
  const pieOption = {
    series: [
      {
        name: "Source",
        type: "pie",
        legendHoverLink: true,
        hoverAnimation: true,
        avoidLabelOverlap: true,
        startAngle: 180,
        radius: "55%",
        center: ["50%", "35%"],
        data: [
          { value: 105.2, name: "android" },
          { value: 310, name: "iOS" },
          { value: 234, name: "web" },
          { value: 134, name: "harmony" },
        ],
        label: {
          normal: {
            show: true,
            textStyle: {
              fontSize: 12,
              color: "#23273C",
            },
          },
        },
      },
    ],
  };

  // 柱状图配置
  const barOption = {
    xAxis: {
      type: 'category',
      data: ['Mon', 'Tue', 'Wed', 'Thu', 'Fri', 'Sat', 'Sun']
    },
    yAxis: {
      type: 'value'
    },
    series: [
      {
        data: [120, 200, 150, 80, 70, 110, 130],
        type: 'bar',
        showBackground: true,
        backgroundStyle: {
          color: 'rgba(180, 180, 180, 0.2)'
        }
      }
    ]
  };

  // 折线图配置
  const lineOption = {
    xAxis: {
      type: 'category',
      data: ['Mon', 'Tue', 'Wed', 'Thu', 'Fri', 'Sat', 'Sun']
    },
    yAxis: {
      type: 'value'
    },
    series: [
      {
        data: [820, 932, 901, 934, 1290, 1330, 1320],
        type: 'line',
        smooth: true
      }
    ]
  };

  const getChartOption = () => {
    switch (chartType) {
      case 'pie':
        return pieOption;
      case 'bar':
        return barOption;
      case 'line':
        return lineOption;
      default:
        return pieOption;
    }
  };

  return (
    <SafeAreaView style={styles.container}>
      <ScrollView style={styles.scrollView}>
        <View style={styles.content}>
          <Text style={styles.title}>ECharts 图表演示</Text>

          {/* 图表类型选择 */}
          <View style={styles.section}>
            <Text style={styles.sectionTitle}>图表类型</Text>
            <View style={styles.buttonRow}>
              <TouchableOpacity
                style={[
                  styles.typeButton,
                  chartType === 'pie' && styles.activeButton,
                ]}
                onPress={() => setChartType('pie')}
              >
                <Text style={styles.typeButtonText}>饼图</Text>
              </TouchableOpacity>
              <TouchableOpacity
                style={[
                  styles.typeButton,
                  chartType === 'bar' && styles.activeButton,
                ]}
                onPress={() => setChartType('bar')}
              >
                <Text style={styles.typeButtonText}>柱状图</Text>
              </TouchableOpacity>
              <TouchableOpacity
                style={[
                  styles.typeButton,
                  chartType === 'line' && styles.activeButton,
                ]}
                onPress={() => setChartType('line')}
              >
                <Text style={styles.typeButtonText}>折线图</Text>
              </TouchableOpacity>
            </View>
          </View>

          {/* 图表 */}
          <View style={styles.chartContainer}>
            <View style={{ height: 300, paddingTop: 25 }}>
              <RNEChartsPro height={250} option={getChartOption()} />
            </View>
          </View>

          {/* 功能说明 */}
          <View style={styles.infoSection}>
            <Text style={styles.infoTitle}>功能说明:</Text>
            <Text style={styles.infoText}>
              • 支持 20+ 种图表类型
            </Text>
            <Text style={styles.infoText}>
              • 完全支持 ECharts 配置项
            </Text>
            <Text style={styles.infoText}>
              • 支持多种主题样式
            </Text>
            <Text style={styles.infoText}>
              • 支持动态数据更新
            </Text>
            <Text style={styles.infoText}>
              • 支持事件交互
            </Text>
            <Text style={styles.infoText}>
              • 支持扩展插件(词云、地图等)
            </Text>
          </View>

          {/* 注意事项 */}
          <View style={styles.noteSection}>
            <Text style={styles.noteTitle}>注意事项:</Text>
            <Text style={styles.noteText}>
              • 需要先引入 react-native-webview 依赖
            </Text>
            <Text style={styles.noteText}>
              • 图表配置需符合 ECharts 规范
            </Text>
            <Text style={styles.noteText}>
              • 大量数据时建议使用数据缩放
            </Text>
            <Text style={styles.noteText}>
              • 自定义字体暂不支持(HarmonyOS 平台限制)
            </Text>
          </View>
        </View>
      </ScrollView>
    </SafeAreaView>
  );
}

const styles = StyleSheet.create({
  container: {
    flex: 1,
    backgroundColor: '#f5f5f5',
  },
  scrollView: {
    flex: 1,
  },
  content: {
    padding: 15,
  },
  title: {
    fontSize: 24,
    fontWeight: 'bold',
    marginBottom: 20,
    textAlign: 'center',
    color: '#333',
  },
  section: {
    marginBottom: 20,
    padding: 15,
    backgroundColor: '#fff',
    borderRadius: 10,
    shadowColor: '#000',
    shadowOffset: { width: 0, height: 2 },
    shadowOpacity: 0.1,
    shadowRadius: 4,
    elevation: 3,
  },
  sectionTitle: {
    fontSize: 16,
    fontWeight: 'bold',
    marginBottom: 10,
    color: '#333',
  },
  buttonRow: {
    flexDirection: 'row',
    gap: 10,
  },
  typeButton: {
    flex: 1,
    paddingVertical: 12,
    backgroundColor: '#f0f0f0',
    borderRadius: 8,
    alignItems: 'center',
  },
  activeButton: {
    backgroundColor: '#42a5f5',
  },
  activeButtonText: {
    color: '#fff',
    fontWeight: 'bold',
  },
  typeButtonText: {
    color: '#333',
    fontSize: 14,
  },
  chartContainer: {
    marginBottom: 20,
    borderRadius: 10,
    overflow: 'hidden',
    shadowColor: '#000',
    shadowOffset: { width: 0, height: 2 },
    shadowOpacity: 0.1,
    shadowRadius: 4,
    elevation: 3,
  },
  infoSection: {
    marginBottom: 20,
    padding: 15,
    backgroundColor: '#e3f2fd',
    borderRadius: 8,
    borderLeftWidth: 4,
    borderLeftColor: '#42a5f5',
  },
  infoTitle: {
    fontSize: 14,
    fontWeight: 'bold',
    marginBottom: 8,
    color: '#1565c0',
  },
  infoText: {
    fontSize: 13,
    color: '#1976d2',
    marginBottom: 4,
  },
  noteSection: {
    marginBottom: 20,
    padding: 15,
    backgroundColor: '#fff3cd',
    borderRadius: 8,
    borderLeftWidth: 4,
    borderLeftColor: '#ffc107',
  },
  noteTitle: {
    fontSize: 14,
    fontWeight: 'bold',
    marginBottom: 8,
    color: '#856404',
  },
  noteText: {
    fontSize: 13,
    color: '#856404',
    marginBottom: 4,
  },
});

export default EChartsDemo;
🎨 实际应用场景
react-native-echarts-pro 可以应用于以下实际场景:
- 数据分析应用: 展示销售数据、用户增长、财务报表等
- 商业智能应用: 制作仪表盘、KPI 监控、趋势分析
- 金融应用: K线图、股票走势、财务报表
- 物联网应用: 设备监控、传感器数据可视化
- 医疗应用: 病历分析、医疗数据统计
- 教育应用: 成绩统计、学习进度追踪
- 电商应用: 销售分析、用户行为分析
- 社交应用: 数据统计、用户活跃度分析
⚠️ 注意事项与最佳实践
1. 依赖配置
确保先引入 react-native-webview:
npm install @react-native-oh-tpl/react-native-webview
2. 图表配置
确保图表配置符合 ECharts 规范:
// ✅ 推荐:正确的图表配置
const option = {
  title: {
    text: '图表标题',
    left: 'center',
  },
  tooltip: {
    trigger: 'axis',
  },
  xAxis: {
    type: 'category',
    data: ['Mon', 'Tue', 'Wed', 'Thu', 'Fri', 'Sat', 'Sun'],
  },
  yAxis: {
    type: 'value',
  },
  series: [
    {
      data: [120, 200, 150, 80, 70, 110, 130],
      type: 'bar',
    },
  ],
};
3. 性能优化
// ✅ 推荐:使用数据缩放处理大量数据
const option = {
  dataZoom: [
    {
      type: 'inside',
      start: 0,
      end: 100,
    },
    {
      type: 'slider',
      start: 0,
      end: 100,
    },
  ],
  // ... 其他配置
};

// ✅ 推荐:避免频繁更新图表数据
// 使用防抖或节流控制更新频率
4. 动态更新数据
// ✅ 推荐:使用 ref 更新图表数据
const chartRef = useRef<any>(null);

const updateChartData = (newData: number[]) => {
  if (chartRef.current) {
    chartRef.current.setNewOption({
      series: [
        {
          data: newData,
        },
      ],
    });
  }
};
5. 主题切换
// ✅ 推荐:使用主题名称切换主题
<RNEChartsPro
  option={option}
  themeName="dark"
  backgroundColor="#1a1a1a"
/>
6. HarmonyOS 特殊处理
在 HarmonyOS 上,需要注意:
- 字体限制: 不支持自定义字体(fontFamilies)
- 性能: 大数据量图表可能影响性能
- 交互: 触摸事件完全支持
7. 最佳实践
// ✅ 推荐:封装图表组件
interface ChartProps {
  data: ChartData;
  type: ChartType;
  theme?: 'light' | 'dark';
}

const Chart: React.FC<ChartProps> = ({ data, type, theme = 'light' }) => {
  const option = generateOption(data, type);

  return (
    <RNEChartsPro
      option={option}
      themeName={theme === 'dark' ? 'dark' : ''}
      backgroundColor={theme === 'dark' ? '#1a1a1a' : '#ffffff'}
    />
  );
};
🧪 测试验证
1. Android 平台测试
npm run android
测试要点:
- 测试不同图表类型渲染
- 验证数据缩放功能
- 测试主题切换
- 检查图表性能
2. iOS 平台测试
npm run ios
测试要点:
- 测试图表交互
- 验证动画效果
- 测试数据更新
- 检查内存使用
3. HarmonyOS 平台测试
npm run harmony
测试要点:
- 验证图表渲染
- 测试触摸交互
- 检查性能表现
- 验证主题切换
4. 常见问题排查
问题 1: 图表无法渲染
- 检查 react-native-webview 是否正确配置
- 确认 option 配置正确
- 验证数据格式
问题 2: 图表渲染卡顿
- 减少数据量
- 启用数据缩放
- 优化动画配置
问题 3: 字体样式不生效
- HarmonyOS 平台暂不支持自定义字体
- 使用内置主题或配置颜色
📊 支持的图表类型
| 图表类型 | 类型值 | 说明 |
|---|---|---|
| 折线图 | line | 趋势展示 |
| 柱状图 | bar | 数据对比 |
| 饼图 | pie | 占比展示 |
| 雷达图 | radar | 多维数据 |
| 散点图 | scatter | 数据分布 |
| K线图 | candlestick | 金融数据 |
| 热力图 | heatmap | 数据密度 |
| 关系图 | graph | 关系网络 |
| 漏斗图 | funnel | 转化率 |
| 仪表盘 | gauge | 数据监控 |
| 地图 | map | 地理数据 |
| 词云 | wordCloud | 文本分析 |
| 矩形树图 | treemap | 层级数据 |
📝 总结
通过集成 react-native-echarts-pro,我们为项目添加了强大的数据可视化能力。这个库基于 Apache ECharts 构建,提供了完整的图表绘制解决方案,支持 20+ 种图表类型,并且完全跨平台兼容。
关键要点回顾
- ✅ 安装依赖: 根据 RN 版本安装对应的 react-native-echarts-pro 版本
- ✅ 配置依赖: 需要先引入 react-native-webview
- ✅ 集成代码: 使用
RNEChartsPro组件 - ✅ 支持功能: 20+ 图表类型、主题切换、数据缩放、动态更新等
- ✅ 重要: 需要正确配置 ECharts option
实际效果
- Android: 流畅的图表渲染体验
- iOS: 高质量的图表展示
- HarmonyOS: 一致的图表体验
遗留问题
- ❌ 字体自定义: HarmonyOS 平台暂不支持自定义字体(fontFamilies)
欢迎加入开源鸿蒙跨平台社区:https://openharmonycrossplatform.csdn.net

讨论HarmonyOS开发技术,专注于API与组件、DevEco Studio、测试、元服务和应用上架分发等。
更多推荐



 13
13 0
0- 0


 已为社区贡献8条内容

所有评论(0)