饼图与环形图鸿蒙PC用Electron框架实现详解
欢迎加入开源鸿蒙PC社区:
https://harmonypc.csdn.net/
atomgit仓库地址: https://atomgit.com/m0_66062719/fl_char_tableshow
1. 概述
1.1 饼图与环形图的概念
饼图和环形图是展示比例数据最直观的可视化形式之一。它们通过将一个圆分割成多个扇区来表达各部分占整体的比例关系。饼图呈完整的圆形,各个扇区的大小直接对应数据值的大小;环形图则是饼图的变体,中心区域被挖空形成一个环形,视觉上更加轻盈,也便于在中心区域展示汇总信息。
这两种图表在日常工作中应用广泛。在商业领域,它们常用于展示市场份额、预算分配、人口构成等;在项目管理中,可以展示资源分配、进度完成度等;在数据分析中,则常用于展示分类数据的占比情况。可以说,只要涉及"部分与整体"关系的展示,饼图和环形图都是很好的选择。
与之前介绍的折线图和柱状图不同,饼图使用的是极坐标系而非直角坐标系,所有数据都围绕圆心展开,每个数据点对应一个扇区。这种坐标系的转换带来了一些独特的实现挑战,比如角度计算、扇区绘制、标注定位等。本文将详细介绍如何用纯Canvas 2D API实现饼图和环形图组件。
1.2 两种图表的对比
饼图和环形图虽然本质相同,但在视觉呈现和使用场景上有一些差异:
视觉重量:饼图是实心的,整体感强,适合强调"完整性"的概念;环形图中心镂空,视觉上更轻盈,适合需要展示多个图表并排的场景。
信息承载:饼图的中心区域被浪费了,但可以通过添加中心文本来展示关键汇总数据;环形图充分利用了这个空间,可以放一个大的汇总数字或者标题。
数据量适配:当数据分类较多时(比如超过8个),饼图的扇区会变得细碎难以阅读;环形图虽然也存在这个问题,但可以通过将小扇区合并为"其他"类别来缓解。
适用场景:饼图适合展示少量(3-7个)分类的占比关系;环形图适合在仪表盘或信息卡片中作为辅助可视化元素。
2. 架构设计
2.1 组件架构概览
饼图组件的架构设计与折线图、柱状图有所不同。由于使用的是极坐标系,组件需要处理角度计算而不是线性映射。
class PieChart {
    constructor(canvasId, data, options = {}) {
        // 核心属性
        this.canvas = null;
        this.ctx = null;
        this.data = null;
        this.options = {};

        // 尺寸相关
        this.width = 0;
        this.height = 0;
        this.dpr = 1;

        // 饼图特定参数
        this.centerX = 0;
        this.centerY = 0;
        this.radius = 0;
        this.innerRadius = 0;  // 环形图的内半径,0表示普通饼图

        // 动画相关
        this.animationProgress = 1;
        this.isAnimating = false;

        // 交互相关
        this.hoveredSlice = null;
        this.selectedSlice = null;

        // 初始化
        this.init(canvasId, data, options);
    }

    init(canvasId, data, options) {
        // 获取Canvas元素
        this.canvas = document.getElementById(canvasId);
        if (!this.canvas) {
            throw new Error(`Canvas element with id "${canvasId}" not found`);
        }

        // 获取绑定上下文
        this.ctx = this.canvas.getContext('2d');

        // 合并配置
        this.options = { ...this.getDefaultOptions(), ...options };

        // 设置数据
        this.setData(data);

        // 初始化尺寸
        this.resize();

        // 绑定事件
        this.bindEvents();

        // 渲染
        this.render();
    }

    getDefaultOptions() {
        return {
            animated: true,
            animationDuration: 800,
            showLabels: true,
            minLabelPercent: 5,  // 小于此百分比不显示标签
            showLegend: true,
            legendPosition: 'bottom',
            sliceGap: 2,  // 扇区之间的间隙
            hoverEffect: true,
            explodeDistance: 10  // 悬停时扇区突出的距离
        };
    }
}
2.2 模块划分
饼图组件的功能模块划分如下:
角度计算模块:负责计算每个扇区占据的角度。这需要先计算数据的总和,然后将每个数据值转换为占总和的比例,再乘以360度得到扇区角度。
扇区绘制模块:负责使用Canvas的圆弧API绘制扇区。需要处理普通饼图和环形图两种情况,环形图实际上是带有内半径的扇区。
标签定位模块:负责计算标签的显示位置。对于百分比较大的扇区,标签直接显示在扇区内部;对于较小的扇区,标签可能需要显示在外部并用引导线连接。
交互处理模块:负责处理扇区的悬停和点击事件。需要实现扇区的高亮效果,以及提示框的显示。
动画控制模块:负责实现扇区从无到有的入场动画,以及数据更新时的过渡动画。
3. 核心代码实现
3.1 角度计算算法
角度计算是饼图绑定的核心。每个扇区占据的角度取决于它占数据总和的比例。
class PieChart {
    // 计算扇区数据
    calculateSlices() {
        const total = this.data.datasets[0].data.reduce((sum, val) => sum + val, 0);

        // 计算每个扇区的角度
        let currentAngle = this.options.startAngle || -Math.PI / 2;

        const slices = this.data.datasets[0].data.map((value, index) => {
            // 计算扇区角度
            const percentage = value / total;
            const angle = percentage * Math.PI * 2;
            const endAngle = currentAngle + angle;

            // 计算扇区中心角度(用于定位标签)
            const midAngle = currentAngle + angle / 2;

            const slice = {
                index,
                value,
                percentage,
                startAngle: currentAngle,
                endAngle,
                midAngle,
                color: this.data.datasets[0].colors[index],
                label: this.data.labels[index]
            };

            currentAngle = endAngle;
            return slice;
        });

        return slices;
    }

    // 计算布局参数
    calculateLayout() {
        // 计算中心点
        this.centerX = this.width / 2;
        this.centerY = this.height / 2;

        // 计算半径
        // 取宽度和高度的较小值,除以2后减去边距
        const maxRadius = Math.min(this.width, this.height) / 2 - 30;

        // 普通饼图没有内半径,环形图有内半径
        if (this.options.innerRadius !== undefined) {
            this.radius = maxRadius;
            this.innerRadius = this.options.innerRadius;
        } else if (this.options.type === 'doughnut') {
            // 环形图默认内半径是外半径的55%
            this.radius = maxRadius;
            this.innerRadius = maxRadius * 0.55;
        } else {
            // 普通饼图
            this.radius = maxRadius;
            this.innerRadius = 0;
        }
    }

    // 获取扇区的原点偏移(用于悬停效果)
    getSliceOffset(slice, explode = false) {
        if (!explode) return { x: 0, y: 0 };

        const distance = this.options.explodeDistance;
        return {
            x: Math.cos(slice.midAngle) * distance,
            y: Math.sin(slice.midAngle) * distance
        };
    }
}
角度计算的起始点设置为-Math.PI / 2(负90度),这是Canvas坐标系中12点钟方向的位置,让第一个扇区从顶部开始,顺时针方向排列。
扇区的中心角度(midAngle)用于定位标签。标签通常放置在扇区的中间位置,这样既能利用扇区的空间,又能让标签与扇区保持视觉上的关联。
3.2 扇区绘制
Canvas提供了arc和arcTo方法来绘制圆弧,结合moveTo和lineTo可以绘制扇区。
class PieChart {
    // 绘制单个扇区
    drawSlice(slice, offsetX = 0, offsetY = 0, progress = 1) {
        const ctx = this.ctx;
        const cx = this.centerX + offsetX;
        const cy = this.centerY + offsetY;

        ctx.save();

        // 开始新路径
        ctx.beginPath();

        // 移动到内半径起点(或外半径起点,如果没有内半径)
        if (this.innerRadius > 0) {
            // 环形图:从外半径开始
            const startX = cx + Math.cos(slice.startAngle) * this.radius;
            const startY = cy + Math.sin(slice.startAngle) * this.radius;
            ctx.moveTo(startX, startY);

            // 画外圆弧
            ctx.arc(cx, cy, this.radius, slice.startAngle, slice.endAngle);

            // 画内圆弧(反向)
            const innerEndX = cx + Math.cos(slice.endAngle) * this.innerRadius;
            const innerEndY = cy + Math.sin(slice.endAngle) * this.innerRadius;
            ctx.lineTo(innerEndX, innerEndY);
            ctx.arc(cx, cy, this.innerRadius, slice.endAngle, slice.startAngle, true);
            ctx.closePath();
        } else {
            // 普通饼图
            ctx.moveTo(cx, cy);
            ctx.arc(cx, cy, this.radius, slice.startAngle, slice.endAngle);
            ctx.closePath();
        }

        // 创建渐变(可选)
        const gradient = this.createSliceGradient(cx, cy, slice);
        ctx.fillStyle = gradient || slice.color;

        // 填充
        ctx.fill();

        // 绘制边框
        ctx.strokeStyle = 'rgba(0, 0, 0, 0.1)';
        ctx.lineWidth = 1;
        ctx.stroke();

        ctx.restore();

        // 返回扇区边界用于交互检测
        return {
            startAngle: slice.startAngle,
            endAngle: slice.endAngle,
            innerRadius: this.innerRadius,
            outerRadius: this.radius,
            centerX: cx,
            centerY: cy,
            color: slice.color
        };
    }

    // 创建扇区渐变
    createSliceGradient(cx, cy, slice) {
        if (!this.options.gradient) return null;

        const gradient = this.ctx.createRadialGradient(
            cx, cy, this.innerRadius,
            cx, cy, this.radius
        );

        // 从深到浅的渐变
        gradient.addColorStop(0, this.adjustColorBrightness(slice.color, 0.7));
        gradient.addColorStop(1, this.adjustColorBrightness(slice.color, 1.0));

        return gradient;
    }

    // 调整颜色亮度
    adjustColorBrightness(hexColor, factor) {
        const r = parseInt(hexColor.slice(1, 3), 16);
        const g = parseInt(hexColor.slice(3, 5), 16);
        const b = parseInt(hexColor.slice(5, 7), 16);

        const newR = Math.min(255, Math.round(r * factor));
        const newG = Math.min(255, Math.round(g * factor));
        const newB = Math.min(255, Math.round(b * factor));

        return `rgb(${newR}, ${newG}, ${newB})`;
    }

    // 绘制所有扇区
    drawSlices(progress = 1) {
        const slices = this.calculateSlices();

        // 保存扇区边界用于交互
        this.sliceBounds = [];

        slices.forEach((slice, index) => {
            // 根据动画进度调整结束角度
            let animSlice = { ...slice };
            if (progress < 1) {
                const angleRange = slice.endAngle - slice.startAngle;
                animSlice.endAngle = slice.startAngle + angleRange * progress;
            }

            const bounds = this.drawSlice(animSlice);
            this.sliceBounds.push(bounds);
        });
    }
}
环形图的扇区绘制比普通饼图复杂一些。普通饼图只需要从圆心出发,画到外半径,再画圆弧回到圆心。环形图则需要画外圆弧、画到内半径、画内圆弧(反向)、回到外半径起点,形成一个环形的闭合路径。
渐变效果可以增强视觉层次感。径向渐变从内到外颜色由深变浅,让扇区看起来有立体感。
3.3 标签绘制
标签的定位需要考虑扇区的大小和位置。对于较大的扇区,标签可以直接放在扇区内部;对于较小的扇区,标签可能需要显示在外面。
class PieChart {
    // 绘制标签
    drawLabels() {
        if (!this.options.showLabels) return;

        const slices = this.calculateSlices();
        const ctx = this.ctx;

        slices.forEach(slice => {
            // 只显示大于阈值的扇区标签
            if (slice.percentage * 100 < this.options.minLabelPercent) {
                return;
            }

            // 计算标签位置
            const labelRadius = this.radius * 0.65;
            const labelX = this.centerX + Math.cos(slice.midAngle) * labelRadius;
            const labelY = this.centerY + Math.sin(slice.midAngle) * labelRadius;

            // 绘制百分比文字
            ctx.fillStyle = '#fff';
            ctx.font = 'bold 12px sans-serif';
            ctx.textAlign = 'center';
            ctx.textBaseline = 'middle';

            const percentText = Math.round(slice.percentage * 100) + '%';
            ctx.fillText(percentText, labelX, labelY);
        });
    }

    // 绘制图例
    drawLegend() {
        if (!this.options.showLegend) return;

        const ctx = this.ctx;
        const slices = this.calculateSlices();

        // 根据图例位置计算起始坐标
        let startX, startY, itemWidth, itemHeight;

        switch (this.options.legendPosition) {
            case 'bottom':
                startX = this.width / 2 - (slices.length * 80) / 2;
                startY = this.height - 30;
                itemWidth = 80;
                itemHeight = 20;
                break;
            case 'right':
                startX = this.width - 150;
                startY = this.centerY - (slices.length * 25) / 2;
                itemWidth = 140;
                itemHeight = 20;
                break;
            default:
                startX = 20;
                startY = this.height - 30;
                itemWidth = 80;
                itemHeight = 20;
        }

        // 绘制每个图例项
        slices.forEach((slice, index) => {
            const x = startX + (index * itemWidth) % (this.width - 40);
            const y = startY + Math.floor(index * itemWidth / (this.width - 40)) * itemHeight;

            // 绘制颜色方块
            ctx.fillStyle = slice.color;
            ctx.fillRect(x, y - 6, 12, 12);

            // 绘制标签
            ctx.fillStyle = 'rgba(255, 255, 255, 0.8)';
            ctx.font = '11px sans-serif';
            ctx.textAlign = 'left';
            ctx.textBaseline = 'middle';
            ctx.fillText(slice.label, x + 18, y);

            // 绘制百分比
            ctx.fillStyle = 'rgba(255, 255, 255, 0.6)';
            ctx.fillText(`(${Math.round(slice.percentage * 100)}%)`, x + 18 + ctx.measureText(slice.label).width + 5, y);
        });
    }

    // 绘制中心文字(环形图)
    drawCenterText(text, subtext) {
        if (this.innerRadius === 0) return;  // 只有环形图才能显示中心文字

        const ctx = this.ctx;

        // 绘制主文字
        ctx.fillStyle = '#fff';
        ctx.font = 'bold 24px sans-serif';
        ctx.textAlign = 'center';
        ctx.textBaseline = 'middle';
        ctx.fillText(text, this.centerX, this.centerY - 10);

        // 绘制副文字
        if (subtext) {
            ctx.fillStyle = 'rgba(255, 255, 255, 0.6)';
            ctx.font = '12px sans-serif';
            ctx.fillText(subtext, this.centerX, this.centerY + 15);
        }
    }
}
标签定位在扇区半径的65%处,这个位置既能清晰显示文字,又不会太靠近边缘。对于百分比太小的扇区(如小于5%),文字会显得拥挤,所以设置了一个阈值跳过这些扇区的标签。
环形图的中心区域可以用来显示汇总数据,比如"总计:1000"或"完成率:75%"。这个功能普通饼图实现不了,因为中心是圆心所在。
3.4 完整渲染流程
将各个绘制步骤整合在一起,形成完整的渲染流程。
class PieChart {
    // 完整的渲染流程
    render() {
        // 计算布局
        this.calculateLayout();

        // 清空画布
        this.ctx.clearRect(0, 0, this.width, this.height);

        // 绘制背景(可选)
        // this.drawBackground();

        // 绘制所有扇区
        this.drawSlices();

        // 绘制标签
        this.drawLabels();

        // 绘制图例
        this.drawLegend();

        // 环形图绘制中心文字
        if (this.options.type === 'doughnut' && this.options.centerText) {
            this.drawCenterText(
                this.options.centerText,
                this.options.centerSubtext
            );
        }
    }

    // 带动画的渲染
    renderAnimated() {
        if (!this.options.animated) {
            this.render();
            return;
        }

        const startTime = Date.now();
        const duration = this.options.animationDuration;

        const animate = () => {
            const elapsed = Date.now() - startTime;
            const progress = Math.min(elapsed / duration, 1);
            const easedProgress = this.easeOutCubic(progress);

            // 清空画布
            this.ctx.clearRect(0, 0, this.width, this.height);

            // 计算布局
            this.calculateLayout();

            // 绘制扇区(带动画进度)
            this.drawSlices(easedProgress);

            // 绘制标签
            this.drawLabels();

            // 绘制图例
            this.drawLegend();

            // 环形图绘制中心文字
            if (this.options.type === 'doughnut' && this.options.centerText) {
                this.drawCenterText(
                    this.options.centerText,
                    this.options.centerSubtext
                );
            }

            if (progress < 1) {
                requestAnimationFrame(animate);
            }
        };

        requestAnimationFrame(animate);
    }

    // 缓动函数
    easeOutCubic(t) {
        return 1 - Math.pow(1 - t, 3);
    }
}
4. 交互功能实现
4.1 扇区悬停检测
饼图的交互检测比柱状图复杂,因为需要判断鼠标是否在某个扇区内。这涉及到极坐标系的数学计算。
class PieChart {
    // 绑定事件
    bindEvents() {
        // 创建提示框
        this.tooltip = document.createElement('div');
        this.tooltip.className = 'pie-chart-tooltip';
        this.applyTooltipStyle();
        this.canvas.parentElement.style.position = 'relative';
        this.canvas.parentElement.appendChild(this.tooltip);

        // 绑定鼠标事件
        this.canvas.addEventListener('mousemove', (e) => this.handleMouseMove(e));
        this.canvas.addEventListener('mouseleave', () => this.handleMouseLeave());
        this.canvas.addEventListener('click', (e) => this.handleClick(e));
    }

    // 检测鼠标位置的扇区
    findSliceAtPosition(mouseX, mouseY) {
        // 计算鼠标相对于圆心的位置
        const dx = mouseX - this.centerX;
        const dy = mouseY - this.centerY;

        // 计算距离和角度
        const distance = Math.sqrt(dx * dx + dy * dy);

        // 如果在中心或太远,不在任何扇区
        if (distance < this.innerRadius || distance > this.radius) {
            return null;
        }

        // 计算角度(从3点钟方向开始,顺时针)
        let angle = Math.atan2(dy, dx);

        // 转换为从12点钟方向开始的角度(与扇区计算一致)
        angle = angle + Math.PI / 2;
        if (angle < 0) angle += Math.PI * 2;

        // 查找对应的扇区
        for (const bounds of this.sliceBounds) {
            if (angle >= bounds.startAngle && angle < bounds.endAngle) {
                return bounds;
            }
        }

        return null;
    }

    // 处理鼠标移动
    handleMouseMove(e) {
        const rect = this.canvas.getBoundingClientRect();
        const mouseX = e.clientX - rect.left;
        const mouseY = e.clientY - rect.top;

        const slice = this.findSliceAtPosition(mouseX, mouseY);

        if (slice) {
            if (this.hoveredSlice !== slice) {
                this.hoveredSlice = slice;
                this.redrawWithHighlight(slice);
            }
            this.showTooltip(e.clientX, e.clientY, slice);
        } else {
            this.handleMouseLeave();
        }
    }

    // 高亮重绘
    redrawWithHighlight(highlightedSlice) {
        const ctx = this.ctx;

        // 清空并重绘
        ctx.clearRect(0, 0, this.width, this.height);

        // 计算布局
        this.calculateLayout();

        // 绘制所有扇区
        const slices = this.calculateSlices();
        this.sliceBounds = [];

        slices.forEach((slice, index) => {
            // 检查是否是悬停的扇区
            const bounds = this.sliceBounds[index];
            const isHighlighted = bounds === highlightedSlice;

            // 计算偏移
            const offset = this.getSliceOffset(slice, isHighlighted && this.options.hoverEffect);

            // 绘制扇区
            const newBounds = this.drawSlice(slice, offset.x, offset.y);

            // 如果是悬停的扇区,增强效果
            if (isHighlighted) {
                ctx.save();
                ctx.shadowColor = slice.color;
                ctx.shadowBlur = 20;
                this.drawSlice(slice, offset.x, offset.y);
                ctx.restore();
            }
        });

        // 重新绘制标签和图例
        this.drawLabels();
        this.drawLegend();
    }

    // 显示提示框
    showTooltip(mouseX, mouseY, slice) {
        const sliceData = this.getSliceData(slice);

        let html = `<strong>${sliceData.label}</strong><br>`;
        html += `数值: ${sliceData.value}<br>`;
        html += `占比: ${Math.round(sliceData.percentage * 100)}%`;

        this.tooltip.innerHTML = html;
        this.tooltip.style.opacity = '1';

        // 调整位置
        const tooltipRect = this.tooltip.getBoundingClientRect();
        let left = mouseX + 15;
        let top = mouseY - 10;

        if (left + tooltipRect.width > window.innerWidth) {
            left = mouseX - tooltipRect.width - 15;
        }

        this.tooltip.style.left = left + 'px';
        this.tooltip.style.top = top + 'px';
    }

    // 获取扇区对应的原始数据
    getSliceData(bounds) {
        const index = this.sliceBounds.indexOf(bounds);
        const slices = this.calculateSlices();
        return slices[index];
    }

    // 处理鼠标离开
    handleMouseLeave() {
        if (this.hoveredSlice) {
            this.hoveredSlice = null;
            this.tooltip.style.opacity = '0';
            this.render();
        }
    }

    // 应用提示框样式
    applyTooltipStyle() {
        this.tooltip.style.cssText = `
            position: absolute;
            background: rgba(0, 0, 0, 0.9);
            color: #fff;
            padding: 10px 14px;
            border-radius: 6px;
            font-size: 13px;
            pointer-events: none;
            opacity: 0;
            transition: opacity 0.2s;
            z-index: 1000;
            line-height: 1.5;
        `;
    }
}
扇区检测的数学原理:给定鼠标位置,计算它到圆心的距离和在极坐标系中的角度。然后遍历所有扇区的角度范围,找到包含该角度的扇区。
角度的计算需要注意坐标系的转换。atan2返回的角度是从3点钟方向开始的(弧度),但我们计算扇区时使用的是从12点钟方向开始的角度,所以需要加上90度进行转换。
4.2 点击选中效果
点击选中扇区可以触发进一步的操作或显示更详细的信息。
class PieChart {
    // 处理点击
    handleClick(e) {
        const rect = this.canvas.getBoundingClientRect();
        const mouseX = e.clientX - rect.left;
        const mouseY = e.clientY - rect.top;

        const slice = this.findSliceAtPosition(mouseX, mouseY);

        if (slice) {
            const sliceData = this.getSliceData(slice);

            // 触发回调
            if (this.options.onSliceClick) {
                this.options.onSliceClick(sliceData);
            }

            // 更新选中状态
            if (this.selectedSlice !== slice) {
                this.selectedSlice = slice;
                this.render();
            }
        } else {
            // 点击空白区域,清除选中
            if (this.selectedSlice) {
                this.selectedSlice = null;
                this.render();
            }
        }
    }

    // 更新选中扇区样式
    updateSelectedStyle() {
        if (!this.selectedSlice) return;

        const ctx = this.ctx;
        const slice = this.getSliceData(this.selectedSlice);
        const offset = this.getSliceOffset(slice, true);

        // 绘制突出的扇区
        ctx.save();
        ctx.shadowColor = slice.color;
        ctx.shadowBlur = 25;
        this.drawSlice(slice, offset.x, offset.y);
        ctx.restore();
    }
}
5. 数据处理
5.1 数据验证
接收数据后需要进行验证,确保数据有效。
class PieChart {
    setData(data) {
        // 验证数据结构
        if (!data || typeof data !== 'object') {
            throw new Error('Invalid data: must be an object');
        }

        if (!Array.isArray(data.labels) || data.labels.length === 0) {
            throw new Error('Invalid data: labels must be a non-empty array');
        }

        if (!Array.isArray(data.datasets) || data.datasets.length === 0) {
            throw new Error('Invalid data: datasets must be a non-empty array');
        }

        const dataset = data.datasets[0];

        if (!Array.isArray(dataset.data)) {
            throw new Error('Invalid data: data must be an array');
        }

        if (dataset.data.length !== data.labels.length) {
            console.warn('Warning: data length does not match labels length');
        }

        // 验证数据值
        dataset.data = dataset.data.map((value, index) => {
            const num = Number(value);
            if (isNaN(num) || num < 0) {
                console.warn(`Invalid data value at index ${index}: "${value}" will be treated as 0`);
                return 0;
            }
            return num;
        });

        // 生成默认颜色
        if (!Array.isArray(dataset.colors)) {
            dataset.colors = this.generateColors(dataset.data.length);
        }

        this.data = data;
    }

    // 生成默认颜色
    generateColors(count) {
        const baseColors = [
            '#3b82f6', '#22c55e', '#f59e0b', '#ef4444',
            '#a855f7', '#ec4899', '#14b8a6', '#f97316',
            '#06b6d4', '#8b5cf6', '#84cc16', '#f43f5e'
        ];

        const colors = [];
        for (let i = 0; i < count; i++) {
            colors.push(baseColors[i % baseColors.length]);
        }

        return colors;
    }
}
数据验证确保组件接收到的是有效数据。对于无效的数值(如负数、NaN),给出警告并转换为0。对于缺少颜色配置的情况,自动生成一组默认颜色。
5.2 数据格式化
数据展示时需要进行格式化,让用户更容易理解。
class PieChart {
    // 格式化数值
    formatValue(value) {
        if (this.options.valueFormatter) {
            return this.options.valueFormatter(value);
        }

        if (Math.abs(value) >= 1000000) {
            return (value / 1000000).toFixed(1) + 'M';
        } else if (Math.abs(value) >= 1000) {
            return (value / 1000).toFixed(1) + 'K';
        } else if (Number.isInteger(value)) {
            return value.toString();
        } else {
            return value.toFixed(2);
        }
    }

    // 计算汇总值
    calculateTotal() {
        if (!this.data || !this.data.datasets[0]) return 0;
        return this.data.datasets[0].data.reduce((sum, val) => sum + val, 0);
    }
}
6. 实际应用示例
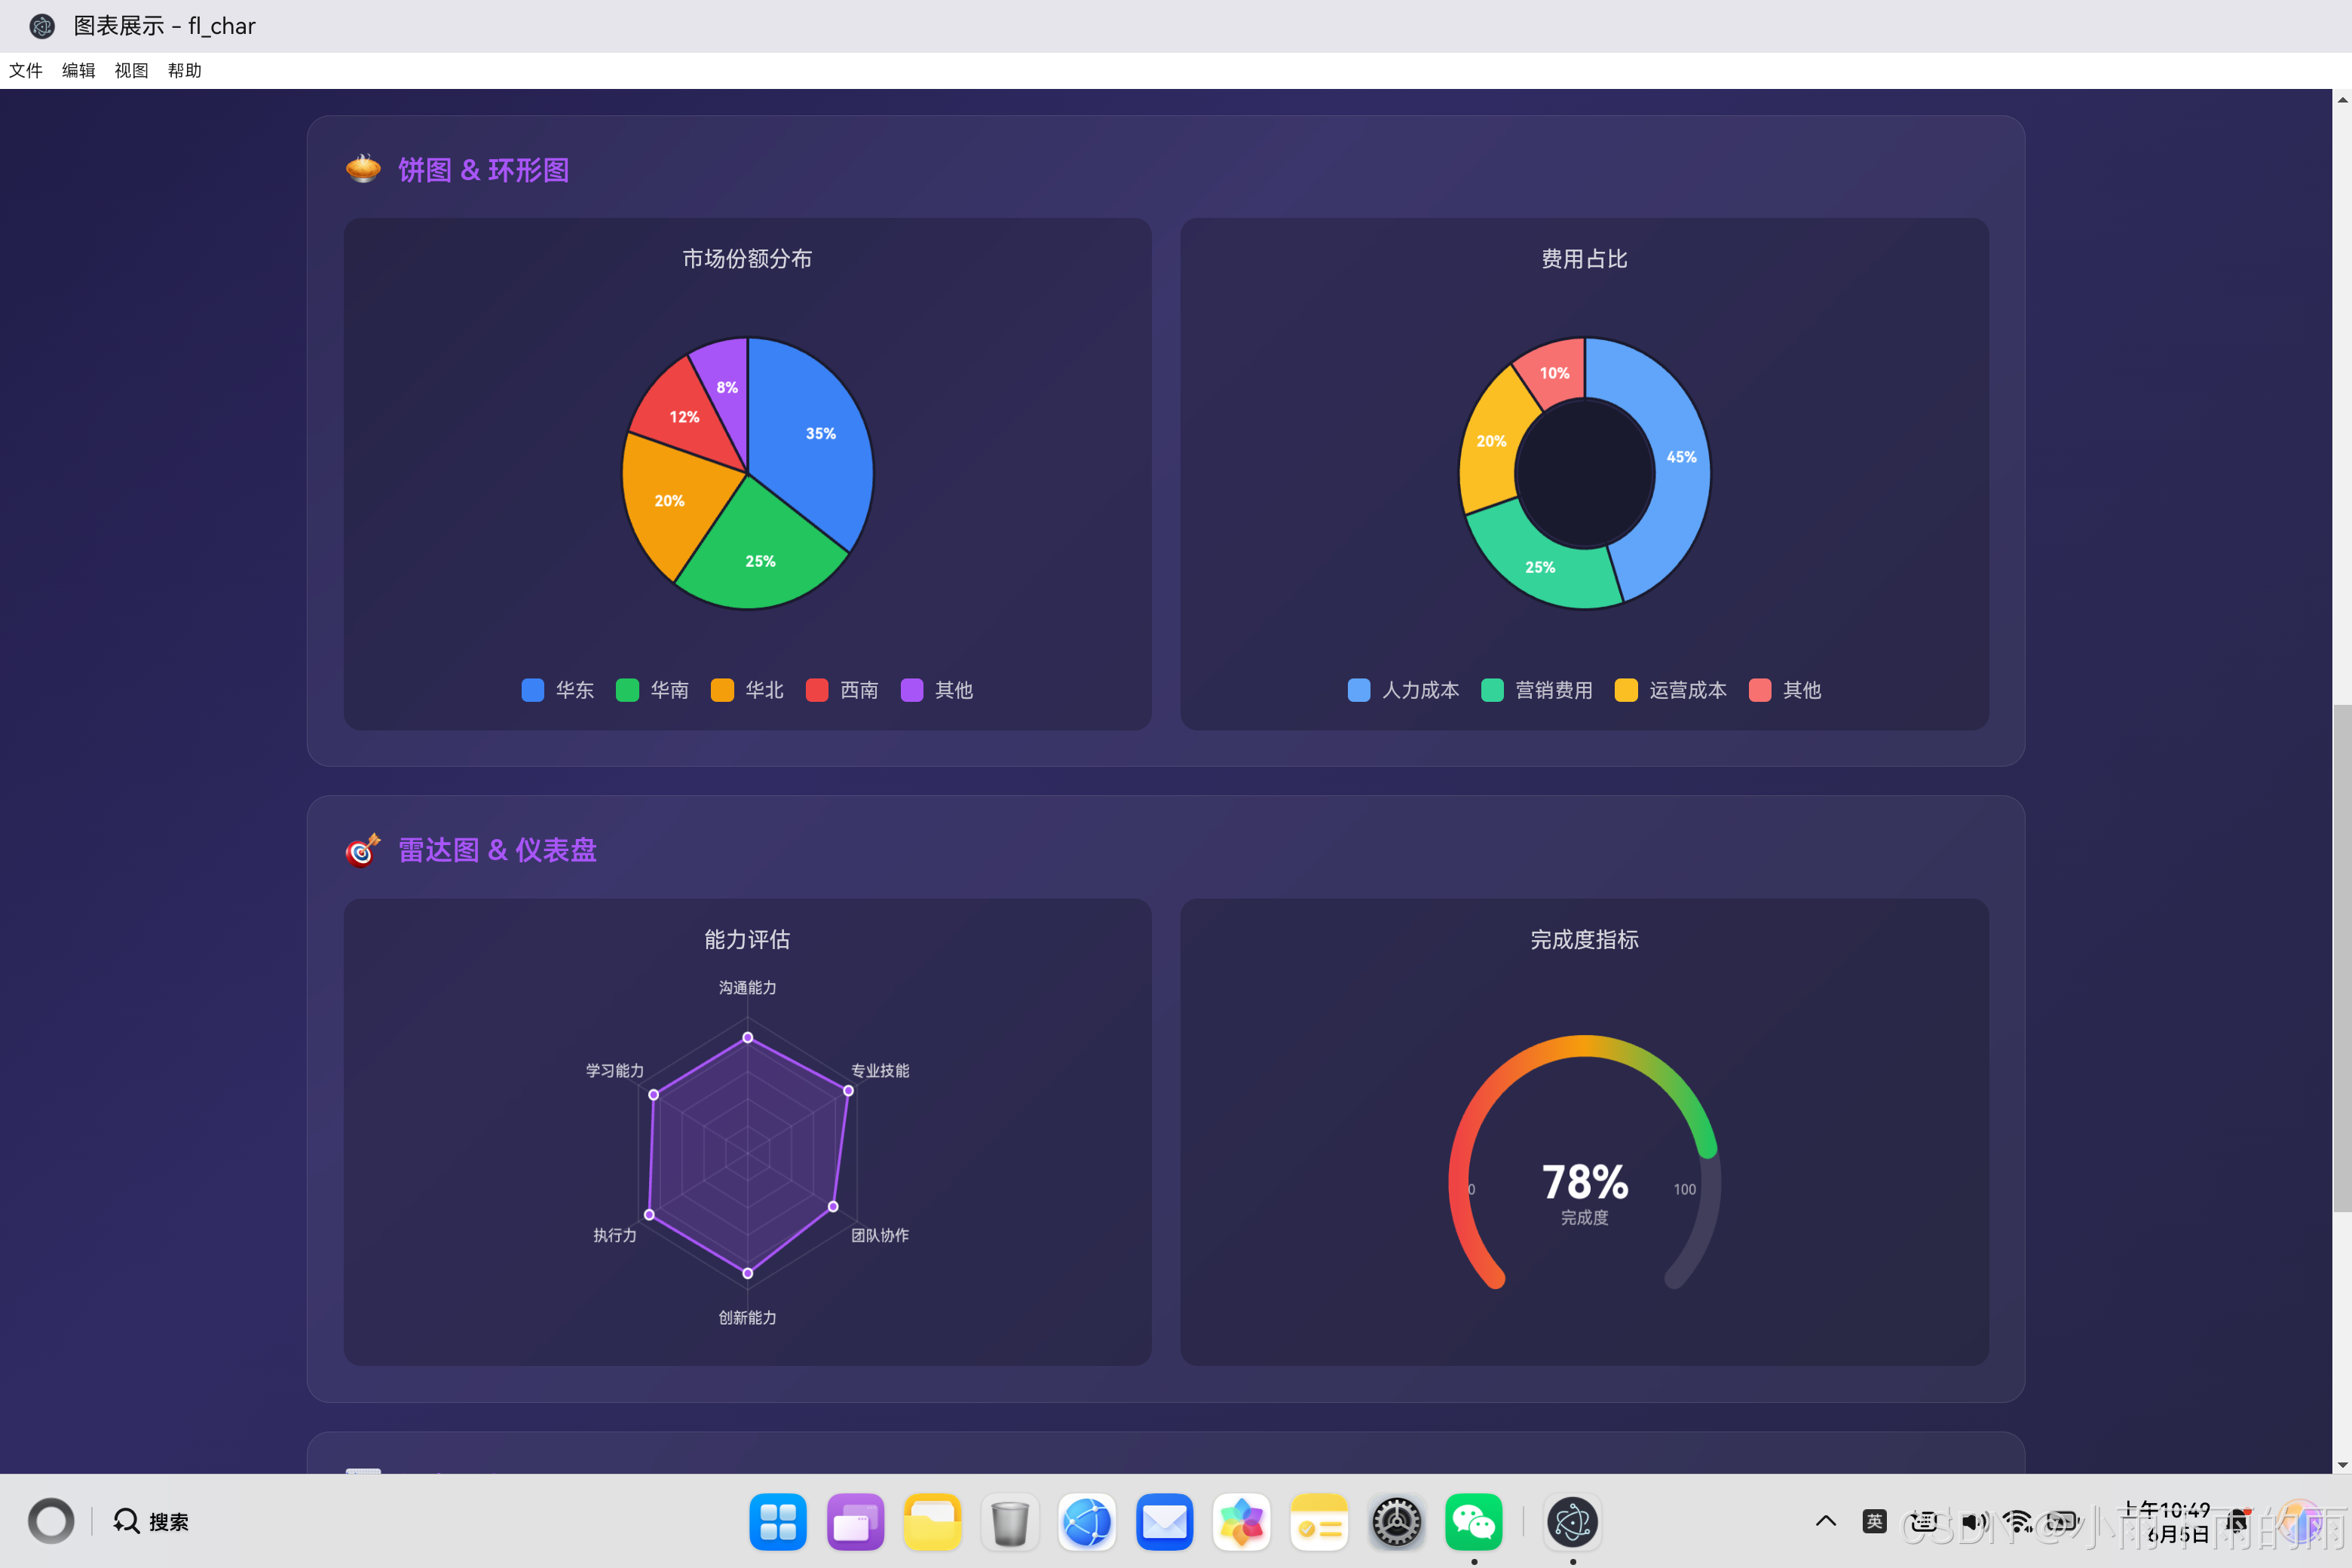
6.1 市场份额展示
const marketData = {
    labels: ['华东', '华南', '华北', '西南', '其他'],
    datasets: [{
        data: [35, 25, 20, 12, 8],
        colors: ['#3b82f6', '#22c55e', '#f59e0b', '#ef4444', '#a855f7']
    }]
};

const pieChart = new PieChart('market-chart', marketData, {
    animated: true,
    showLabels: true,
    showLegend: true,
    legendPosition: 'bottom'
});
6.2 费用占比(环形图)
const costData = {
    labels: ['人力成本', '营销费用', '运营成本', '其他'],
    datasets: [{
        data: [45, 25, 20, 10],
        colors: ['#60a5fa', '#34d399', '#fbbf24', '#f87171']
    }]
};

const total = costData.datasets[0].data.reduce((sum, val) => sum + val, 0);

const doughnutChart = new PieChart('cost-chart', costData, {
    type: 'doughnut',
    innerRadius: 0.55,
    centerText: total.toString(),
    centerSubtext: '总成本',
    animated: true,
    showLegend: true
});
7. 总结
本文详细介绍了饼图和环形图组件的完整实现过程,涵盖以下核心知识点:
-
角度计算算法:将数据值转换为扇区角度,理解极坐标系在Canvas中的应用。
-
扇区绘制技术:使用Canvas的弧线API绘制普通饼图和环形图,处理路径闭合和渐变填充。
-
标签定位策略:根据扇区大小决定标签位置,处理小扇区的标签显示问题。
-
交互检测实现:通过极坐标数学计算实现扇区的悬停和点击检测。
-
动画效果:使用进度控制实现扇区的入场动画效果。
-
环形图特性:环形图的内半径处理和中心文字显示功能。
饼图和环形图虽然相对简单,但要实现一个完善的组件仍然需要考虑诸多细节。角度计算、扇区检测、标签定位等都是需要仔细处理的技术点。希望读者通过本文的学习,能够掌握饼图绑定的核心原理。

讨论HarmonyOS开发技术,专注于API与组件、DevEco Studio、测试、元服务和应用上架分发等。
更多推荐


 0
0 0
0- 0


 已为社区贡献79条内容

所有评论(0)