仪表盘图表技术——鸿蒙PC用Electron框架实现-技术点:fl_char
欢迎加入开源鸿蒙PC社区:
https://harmonypc.csdn.net/
atomgit仓库地址: https://atomgit.com/m0_66062719/fl_char_tableshow
1. 概述
1.1 仪表盘图表的概念与特点
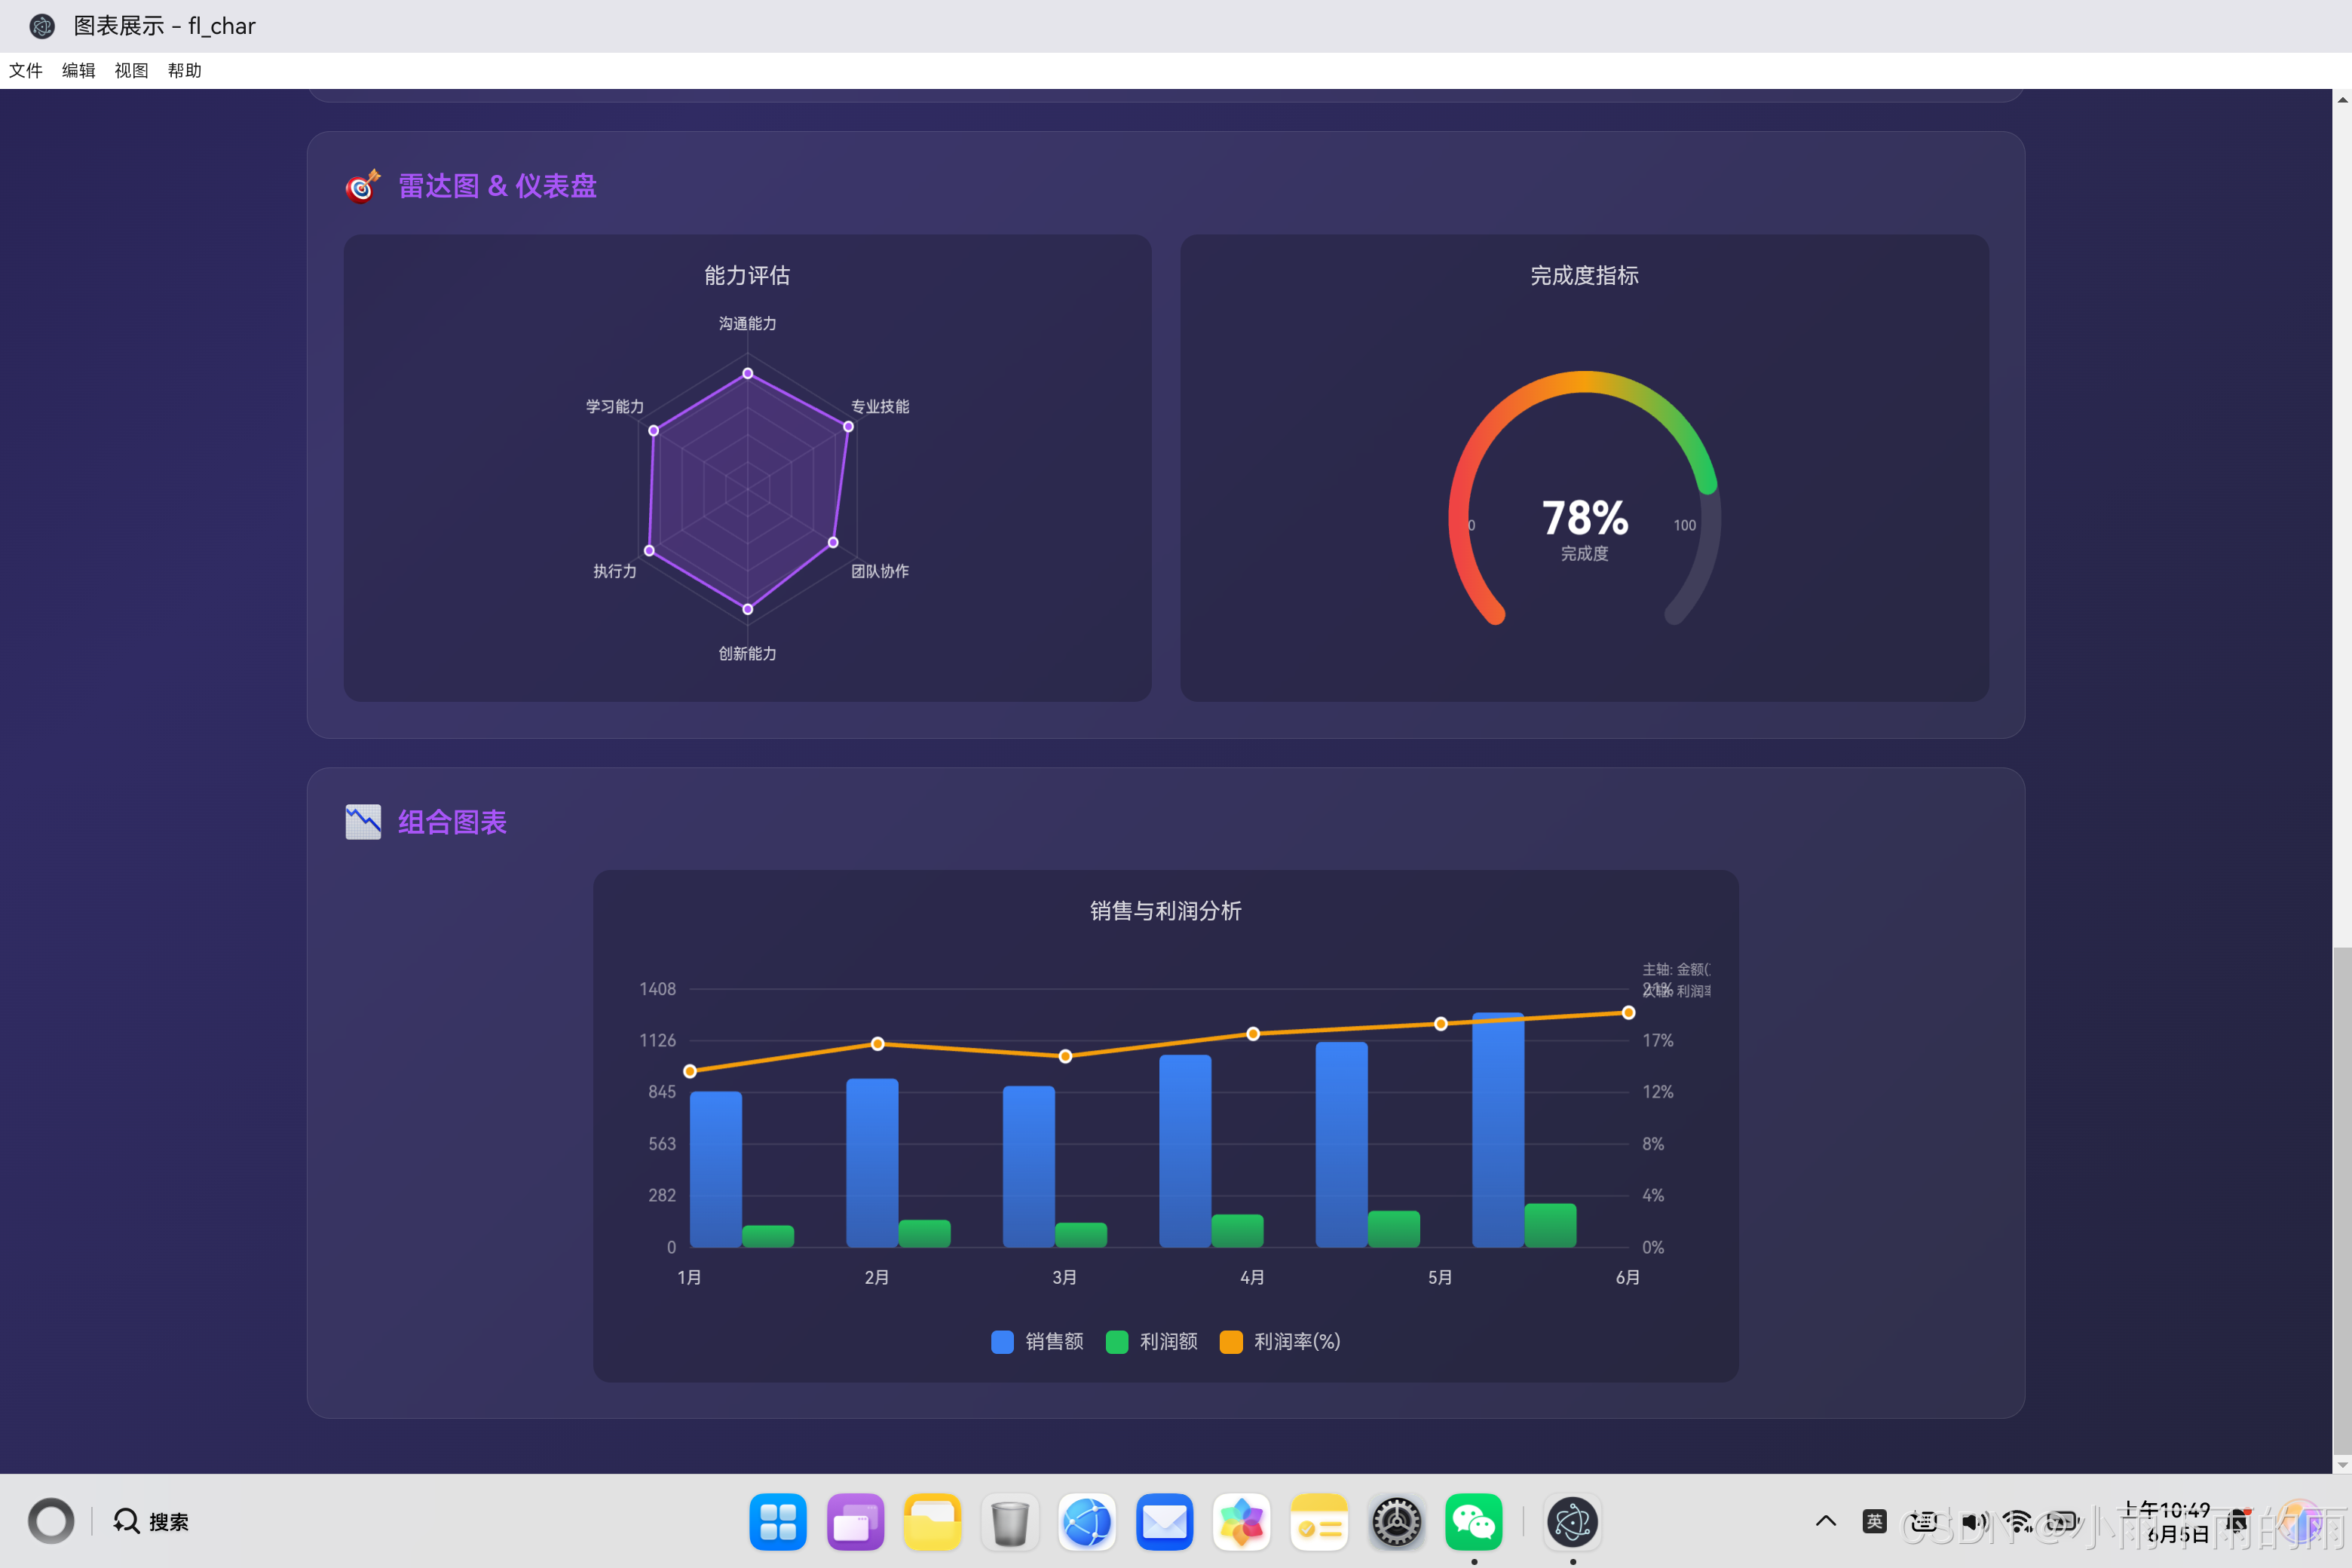
仪表盘图表是一种极具视觉表现力的数据可视化形式,它模拟了现实世界中汽车仪表盘或工业仪表的外观,通过弧形或圆形的刻度盘来展示单一指标的当前值。这种图表类型最常用于展示进度完成度、性能指标、状态监控等场景,能够让用户一眼就判断出当前值处于什么范围是好是坏。
仪表盘图表的核心设计理念是"一目了然"。不同于折线图需要用户阅读数值来判断趋势,也不同于柱状图需要用户比较高度来理解大小,仪表盘通过颜色分区和指针位置,直接传达"这个值在哪里"的信息。当用户看到一个指针指向绿色区域时,立刻知道状态良好;看到指针指向红色区域时,立刻知道需要关注。这种即时理解的能力使仪表盘成为监控仪表板的首选组件。
从历史渊源来看,仪表盘图表确实来源于对真实仪表的模拟。汽车的转速表、速度表,工业上的压力表、温度表,都是这种可视化形式的原型。数字化时代,我们将这种物理形式迁移到屏幕上,保留了其直观性的优点,同时增加了交互性和动态性。
1.2 仪表盘与其他图表的对比
仪表盘图表与其他图表类型有着本质的区别,每种图表有其最佳应用场景。
折线图和面积图适合展示数据随时间的变化趋势,强调的是"线"的流动性和方向性。这类图表让用户关注的是数据如何变化,是增加还是减少,速度如何。而仪表盘只能展示单一时刻的值,无法展示变化过程。如果你需要分析趋势、发现周期性、预测未来,那么折线图是更好的选择;如果你需要立即知道当前状态是好是坏,仪表盘更有优势。
柱状图和条形图适合展示分类数据之间的对比,强调的是"量"的大小关系。这类图表能够在一个视图中展示多个分类的数据,便于进行比较排序。仪表盘只适合展示单一指标,无法进行横向比较。如果你需要知道"哪个地区销量最高",柱状图是更好的选择;如果你需要知道"当前销量是否达到目标",仪表盘更合适。
进度条与仪表盘在功能上有一定重叠,两者都能展示当前值相对于最大值的完成度。但仪表盘通过弧形设计能够承载更多的刻度信息和颜色分区,视觉上更加丰富;进度条则是更加简洁轻量的形式,适合在有限空间内展示多个进度。
1.3 仪表盘的应用场景
仪表盘在实际应用中有着广泛的场景,以下是几个典型的应用领域。
在系统监控和运维领域,仪表盘是展示服务器CPU使用率、内存占用率、磁盘空间、网络流量等指标的标配。这类场景的特点是指标有明确的"健康范围",超出这个范围需要引起注意。通过仪表盘的颜色分区(绿色表示正常、黄色表示警告、红色表示危险),运维人员能够迅速判断系统状态,及时处理问题。
在业务指标展示中,仪表盘常用于展示销售目标完成率、项目进度、转化率、满意度评分等。这类场景的特点是有一个明确的目标值,仪表盘能够直观展示当前值与目标的距离。比如一个销售团队可以通过仪表盘看到本月业绩完成了多少,距离目标还有多远。
在工业控制和物联网场景中,仪表盘用于展示传感器数据,如温度、压力、湿度、流量等。这类场景的特点是需要实时监控,仪表盘的动态更新能力使其成为理想选择。当温度超过安全阈值时,仪表盘能够立即通过颜色变化给出警示。
在个人效率工具中,仪表盘被用于展示习惯打卡完成度、学习进度、健身目标完成情况等。这类应用的设计通常更加精美,强调正向激励,让用户看到自己的进步和成就。
2. 架构设计
2.1 组件架构概览
仪表盘组件的架构设计需要考虑几个核心问题:弧度范围的设计、颜色分区的实现、指针的绘制、以及中心区域的布局。
class GaugeChart {
    constructor(canvasId, data, options = {}) {
        // 核心属性
        this.canvas = null;
        this.ctx = null;
        this.data = null;
        this.options = {};

        // 尺寸相关
        this.width = 0;
        this.height = 0;
        this.dpr = 1;

        // 仪表盘特定参数
        this.centerX = 0;
        this.centerY = 0;
        this.radius = 0;

        // 弧度配置
        this.startAngle = Math.PI * 0.75;  // 起始角度(左侧,135度)
        this.endAngle = Math.PI * 2.25;     // 结束角度(右侧,405度,相当于45度)
        this.valueAngle = 0;                // 当前值的角度

        // 状态管理
        this.animationProgress = 1;
        this.targetValue = 0;
        this.currentValue = 0;

        // 初始化
        this.init(canvasId, data, options);
    }

    init(canvasId, data, options) {
        // 获取Canvas元素
        this.canvas = document.getElementById(canvasId);
        if (!this.canvas) {
            throw new Error(`Canvas element with id "${canvasId}" not found`);
        }

        // 获取绑制上下文
        this.ctx = this.canvas.getContext('2d');

        // 合并配置
        this.options = { ...this.getDefaultOptions(), ...options };

        // 设置数据
        this.setData(data);

        // 初始化尺寸
        this.resize();

        // 绑定事件
        this.bindEvents();

        // 渲染
        this.render();
    }

    getDefaultOptions() {
        return {
            // 弧度配置
            startAngle: Math.PI * 0.75,
            endAngle: Math.PI * 2.25,

            // 数值范围
            minValue: 0,
            maxValue: 100,

            // 颜色配置
            colors: {
                low: '#ef4444',      // 低值区域
                medium: '#f59e0b',   // 中等值区域
                high: '#22c55e'      // 高值区域
            },
            gradientColors: true,

            // 样式配置
            arcWidth: 15,
            backgroundArcColor: 'rgba(255, 255, 255, 0.1)',

            // 刻度配置
            showTicks: true,
            tickCount: 10,
            tickLength: 8,
            tickWidth: 2,

            // 标签配置
            showLabels: true,
            labelOffset: 20,

            // 中心文字配置
            showCenterText: true,
            centerTextFormatter: null,

            // 动画配置
            animate: true,
            animationDuration: 1000,

            // 交互配置
            hoverEffect: true,
            onClick: null
        };
    }
}
2.2 模块划分
仪表盘组件的功能可以分为以下几个核心模块:
弧度计算模块:负责计算仪表盘的起始角度、结束角度、总弧度范围,以及数值与角度之间的映射关系。这个模块是仪表盘的基础,决定了指针和进度弧线的位置。
背景绘制模块:负责绘制仪表盘的背景弧线、刻度线、刻度标签等静态元素。背景是仪表盘的参照系,帮助用户理解刻度含义。
进度绘制模块:负责绘制代表当前值的进度弧线。这条弧线的长度与当前值成正比,颜色可以根据数值范围变化。
指针绘制模块:负责绘制指向当前值的指针。指针是仪表盘最引人注目的元素,它的动态移动能够有效传达数值变化。
中心区域模块:负责绘制中心的数值显示和标签文字。这是用户最关注的信息区域,需要精心设计以确保可读性。
动画控制模块:负责实现数值变化时的平滑过渡动画,让指针和进度弧线从旧值平滑移动到新值。
3. 核心代码实现
3.1 弧度计算算法
弧度计算是仪表盘的核心。不同于饼图使用完整的圆,仪表盘通常只使用圆的一部分(比如270度),这样更符合人类对"仪表"的心理预期。
class GaugeChart {
    // 计算布局参数
    calculateLayout() {
        // 获取逻辑尺寸
        this.width = this.canvas.width / this.dpr;
        this.height = this.canvas.height / this.dpr;

        // 计算中心点
        // Y方向向下偏移,让仪表盘视觉上更加平衡
        this.centerX = this.width / 2;
        this.centerY = this.height / 2 + 20;

        // 计算半径
        // 取宽度和高度的较小值,除以2后减去边距
        const maxRadius = Math.min(this.width, this.height) / 2 - 40;
        this.radius = maxRadius;

        // 保存弧度配置
        this.startAngle = this.options.startAngle;
        this.endAngle = this.options.endAngle;

        // 计算总弧度
        this.totalAngle = this.endAngle - this.startAngle;

        // 标准化角度范围(处理超过2π的情况)
        if (this.totalAngle < 0) {
            this.totalAngle += Math.PI * 2;
        }
    }

    // 将数值转换为角度
    valueToAngle(value) {
        const { minValue, maxValue } = this.options;

        // 归一化到0-1范围
        let normalized = (value - minValue) / (maxValue - minValue);

        // 限制在0-1范围
        normalized = Math.max(0, Math.min(1, normalized));

        // 映射到角度范围
        return this.startAngle + normalized * this.totalAngle;
    }

    // 将角度转换为数值
    angleToValue(angle) {
        const { minValue, maxValue } = this.options;

        // 计算角度占总弧度的比例
        let normalized = (angle - this.startAngle) / this.totalAngle;

        // 限制在0-1范围
        normalized = Math.max(0, Math.min(1, normalized));

        // 映射到数值范围
        return minValue + normalized * (maxValue - minValue);
    }

    // 计算刻度位置
    calculateTicks() {
        const ticks = [];
        const { minValue, maxValue, tickCount } = this.options;
        const valueRange = maxValue - minValue;
        const tickStep = valueRange / tickCount;

        for (let i = 0; i <= tickCount; i++) {
            const value = minValue + i * tickStep;
            const angle = this.valueToAngle(value);

            // 计算刻度线的起点和终点
            const innerRadius = this.radius - this.options.arcWidth / 2 - 5;
            const tickLength = this.options.tickLength;

            const startX = this.centerX + Math.cos(angle) * innerRadius;
            const startY = this.centerY + Math.sin(angle) * innerRadius;
            const endX = this.centerX + Math.cos(angle) * (innerRadius - tickLength);
            const endY = this.centerY + Math.sin(angle) * (innerRadius - tickLength);

            ticks.push({
                value,
                angle,
                startX, startY,
                endX, endY
            });
        }

        return ticks;
    }
}
角度计算的设计考虑了几个重要细节。首先是弧度范围的选择,使用Math.PI * 0.75到Math.PI * 2.25的设置,创造了一个270度的弧度范围,这是仪表盘的经典设计。其次是角度的标准化处理,当totalAngle为负数时(这可能发生在配置错误时),需要加上Math.PI * 2来修正。
3.2 背景绘制技术
仪表盘的背景包括底色弧线和刻度,它们为用户提供了理解数值的参照系。
class GaugeChart {
    // 绘制完整的背景
    drawBackground() {
        this.drawBackgroundArc();
        this.drawTicks();
        this.drawLabels();
    }

    // 绘制背景弧线(底色)
    drawBackgroundArc() {
        const ctx = this.ctx;

        // 设置弧线样式
        ctx.beginPath();
        ctx.arc(this.centerX, this.centerY, this.radius,
                this.startAngle, this.endAngle);
        ctx.strokeStyle = this.options.backgroundArcColor;
        ctx.lineWidth = this.options.arcWidth;
        ctx.lineCap = 'round';
        ctx.stroke();
    }

    // 绘制刻度线
    drawTicks() {
        if (!this.options.showTicks) return;

        const ctx = this.ctx;
        const ticks = this.calculateTicks();

        ticks.forEach((tick, index) => {
            // 设置刻度样式
            ctx.beginPath();
            ctx.moveTo(tick.startX, tick.startY);
            ctx.lineTo(tick.endX, tick.endY);
            ctx.strokeStyle = 'rgba(255, 255, 255, 0.4)';
            ctx.lineWidth = this.options.tickWidth;
            ctx.lineCap = 'round';
            ctx.stroke();
        });
    }

    // 绘制刻度标签
    drawLabels() {
        if (!this.options.showLabels) return;

        const ctx = this.ctx;
        const ticks = this.calculateTicks();
        const labelRadius = this.radius - this.options.arcWidth / 2 - this.options.labelOffset;

        ticks.forEach((tick, index) => {
            // 只绘制首尾标签
            if (index !== 0 && index !== ticks.length - 1) return;

            const labelX = this.centerX + Math.cos(tick.angle) * labelRadius;
            const labelY = this.centerY + Math.sin(tick.angle) * labelRadius;

            ctx.fillStyle = 'rgba(255, 255, 255, 0.6)';
            ctx.font = '10px sans-serif';
            ctx.textAlign = 'center';
            ctx.textBaseline = 'middle';

            const labelText = index === 0 ?
                this.options.minValue.toString() :
                this.options.maxValue.toString();

            ctx.fillText(labelText, labelX, labelY);
        });
    }
}
背景绘制的设计考虑了视觉层次。背景弧线使用很浅的颜色,作为"轨道"存在,让用户知道刻度的范围。刻度线使用中等亮度的颜色,提供精细的刻度参考。标签只绘制首尾(最小值和最大值),避免过多文字干扰。
3.3 渐变弧线绘制
仪表盘的特色之一是通过颜色渐变来表示数值的"好坏"。绿色通常表示良好状态,黄色表示中等,红色表示危险。
class GaugeChart {
    // 创建渐变
    createGradient() {
        const ctx = this.ctx;

        // 创建线性渐变
        const gradient = ctx.createLinearGradient(
            this.centerX - this.radius,
            this.centerY,
            this.centerX + this.radius,
            this.centerY
        );

        // 从左到右的颜色变化
        gradient.addColorStop(0, this.options.colors.low);
        gradient.addColorStop(0.5, this.options.colors.medium);
        gradient.addColorStop(1, this.options.colors.high);

        return gradient;
    }

    // 绘制渐变进度弧线
    drawGradientArc(value) {
        const ctx = this.ctx;

        // 计算当前值对应的角度
        const valueAngle = this.valueToAngle(value);

        // 创建渐变
        const gradient = this.createGradient();

        // 设置弧线样式
        ctx.beginPath();
        ctx.arc(this.centerX, this.centerY, this.radius,
                this.startAngle, valueAngle);
        ctx.strokeStyle = gradient;
        ctx.lineWidth = this.options.arcWidth;
        ctx.lineCap = 'round';
        ctx.stroke();
    }

    // 绘制分段颜色弧线(精确控制颜色区间)
    drawSegmentedArc(value) {
        const ctx = this.ctx;
        const { minValue, maxValue, colors } = this.options;
        const valueRange = maxValue - minValue;

        // 计算每个颜色区间的阈值
        const lowThreshold = minValue + valueRange * 0.33;
        const highThreshold = minValue + valueRange * 0.66;

        // 确定当前值应该使用的颜色
        let color;
        if (value < lowThreshold) {
            color = colors.low;
        } else if (value < highThreshold) {
            color = colors.medium;
        } else {
            color = colors.high;
        }

        // 计算角度
        const valueAngle = this.valueToAngle(value);

        // 绘制弧线
        ctx.beginPath();
        ctx.arc(this.centerX, this.centerY, this.radius,
                this.startAngle, valueAngle);
        ctx.strokeStyle = color;
        ctx.lineWidth = this.options.arcWidth;
        ctx.lineCap = 'round';
        ctx.stroke();
    }

    // 绘制多段颜色弧线(每段使用不同颜色)
    drawMultiColorArc() {
        const ctx = this.ctx;
        const { minValue, maxValue, colors } = this.options;
        const valueRange = maxValue - minValue;

        // 计算各段阈值
        const lowThreshold = minValue + valueRange * 0.33;
        const highThreshold = minValue + valueRange * 0.66;

        // 计算各段角度
        const lowAngle = this.valueToAngle(lowThreshold);
        const highAngle = this.valueToAngle(highThreshold);

        // 绘制低值段(红色)
        ctx.beginPath();
        ctx.arc(this.centerX, this.centerY, this.radius,
                this.startAngle, lowAngle);
        ctx.strokeStyle = colors.low;
        ctx.lineWidth = this.options.arcWidth;
        ctx.lineCap = 'butt';
        ctx.stroke();

        // 绘制中值段(黄色)
        ctx.beginPath();
        ctx.arc(this.centerX, this.centerY, this.radius,
                lowAngle, highAngle);
        ctx.strokeStyle = colors.medium;
        ctx.lineWidth = this.options.arcWidth;
        ctx.lineCap = 'butt';
        ctx.stroke();

        // 绘制高值段(绿色)
        ctx.beginPath();
        ctx.arc(this.centerX, this.centerY, this.radius,
                highAngle, this.endAngle);
        ctx.strokeStyle = colors.high;
        ctx.lineWidth = this.options.arcWidth;
        ctx.lineCap = 'butt';
        ctx.stroke();
    }
}
渐变实现提供了两种策略。第一种是连续渐变,从一端到另一端颜色平滑过渡,适合追求视觉效果流畅的场景。第二种是分段颜色,在不同区间使用明确的颜色,适合需要精确表达"正常/警告/危险"语义的系统监控场景。
3.4 指针绘制
指针是仪表盘最引人注目的元素,它的绘制需要考虑形状设计和动画效果。
class GaugeChart {
    // 绘制指针
    drawNeedle(value) {
        const ctx = this.ctx;
        const valueAngle = this.valueToAngle(value);

        // 指针的几何参数
        const needleLength = this.radius - this.options.arcWidth / 2 - 10;
        const needleBaseWidth = 8;
        const needleTipWidth = 2;

        // 计算指针的三个关键点
        // 尖端
        const tipX = this.centerX + Math.cos(valueAngle) * needleLength;
        const tipY = this.centerY + Math.sin(valueAngle) * needleLength;

        // 基点左
        const baseAngle = valueAngle + Math.PI / 2;
        const baseLeftX = this.centerX + Math.cos(baseAngle) * needleBaseWidth / 2;
        const baseLeftY = this.centerY + Math.sin(baseAngle) * needleBaseWidth / 2;

        // 基点右
        const baseRightX = this.centerX - Math.cos(baseAngle) * needleBaseWidth / 2;
        const baseRightY = this.centerY - Math.sin(baseAngle) * needleBaseWidth / 2;

        // 绘制指针(三角形)
        ctx.beginPath();
        ctx.moveTo(tipX, tipY);
        ctx.lineTo(baseLeftX, baseLeftY);
        ctx.lineTo(baseRightX, baseRightY);
        ctx.closePath();

        // 填充
        const needleColor = this.getValueColor(value);
        ctx.fillStyle = needleColor;
        ctx.fill();

        // 边框
        ctx.strokeStyle = 'rgba(0, 0, 0, 0.3)';
        ctx.lineWidth = 1;
        ctx.stroke();

        // 绘制中心圆点
        this.drawNeedleCenter();
    }

    // 绘制指针中心圆点
    drawNeedleCenter() {
        const ctx = this.ctx;
        const centerRadius = 12;

        // 外圈
        ctx.beginPath();
        ctx.arc(this.centerX, this.centerY, centerRadius, 0, Math.PI * 2);
        ctx.fillStyle = '#fff';
        ctx.fill();

        // 内圈
        ctx.beginPath();
        ctx.arc(this.centerX, this.centerY, centerRadius - 3, 0, Math.PI * 2);
        const needleColor = this.getValueColor(this.currentValue);
        ctx.fillStyle = needleColor;
        ctx.fill();
    }

    // 根据值获取颜色
    getValueColor(value) {
        const { minValue, maxValue, colors } = this.options;
        const valueRange = maxValue - minValue;

        const lowThreshold = minValue + valueRange * 0.33;
        const highThreshold = minValue + valueRange * 0.66;

        if (value < lowThreshold) {
            return colors.low;
        } else if (value < highThreshold) {
            return colors.medium;
        } else {
            return colors.high;
        }
    }

    // 绘制简化指针(线条形式)
    drawSimpleNeedle(value) {
        const ctx = this.ctx;
        const valueAngle = this.valueToAngle(value);

        const needleLength = this.radius - 20;

        ctx.beginPath();
        ctx.moveTo(this.centerX, this.centerY);
        ctx.lineTo(
            this.centerX + Math.cos(valueAngle) * needleLength,
            this.centerY + Math.sin(valueAngle) * needleLength
        );
        ctx.strokeStyle = '#fff';
        ctx.lineWidth = 3;
        ctx.lineCap = 'round';
        ctx.stroke();

        // 中心圆点
        ctx.beginPath();
        ctx.arc(this.centerX, this.centerY, 8, 0, Math.PI * 2);
        ctx.fillStyle = '#fff';
        ctx.fill();

        ctx.beginPath();
        ctx.arc(this.centerX, this.centerY, 5, 0, Math.PI * 2);
        ctx.fillStyle = this.getValueColor(value);
        ctx.fill();
    }
}
指针绘制采用了三角形设计,这是最常见的仪表盘指针形式。三角形的尖端指向当前值的位置,基座较宽以增加稳定性。指针的颜色根据当前值变化,与弧线颜色保持一致,增强了视觉的统一性。
3.5 中心文字绘制
仪表盘的中心区域通常用于显示主要的数值和标签,这是用户最关注的信息。
class GaugeChart {
    // 绘制中心文字
    drawCenterText(value) {
        if (!this.options.showCenterText) return;

        const ctx = this.ctx;

        // 格式化数值
        let displayValue;
        if (this.options.centerTextFormatter) {
            displayValue = this.options.centerTextFormatter(value);
        } else {
            displayValue = Math.round(value).toString();
        }

        // 绘制主数值
        ctx.fillStyle = '#fff';
        ctx.font = 'bold 32px sans-serif';
        ctx.textAlign = 'center';
        ctx.textBaseline = 'middle';
        ctx.fillText(displayValue, this.centerX, this.centerY - 5);

        // 绘制单位/标签
        if (this.data.label) {
            ctx.fillStyle = 'rgba(255, 255, 255, 0.6)';
            ctx.font = '12px sans-serif';
            ctx.fillText(this.data.label, this.centerX, this.centerY + 20);
        }

        // 绘制百分比符号
        if (this.options.showPercent) {
            ctx.fillStyle = 'rgba(255, 255, 255, 0.4)';
            ctx.font = '14px sans-serif';
            ctx.fillText('%', this.centerX + 35, this.centerY - 5);
        }
    }

    // 绘制范围标签
    drawRangeLabels() {
        const ctx = this.ctx;
        const { minValue, maxValue } = this.options;

        // 左侧标签(低值端)
        const leftAngle = this.startAngle;
        const leftLabelRadius = this.radius + 25;
        const leftX = this.centerX + Math.cos(leftAngle) * leftLabelRadius;
        const leftY = this.centerY + Math.sin(leftAngle) * leftLabelRadius;

        ctx.fillStyle = 'rgba(255, 255, 255, 0.5)';
        ctx.font = '10px sans-serif';
        ctx.textAlign = 'center';
        ctx.textBaseline = 'middle';
        ctx.fillText(minValue.toString(), leftX, leftY);

        // 右侧标签(高值端)
        const rightAngle = this.endAngle;
        const rightLabelRadius = this.radius + 25;
        const rightX = this.centerX + Math.cos(rightAngle) * rightLabelRadius;
        const rightY = this.centerY + Math.sin(rightAngle) * rightLabelRadius;

        ctx.fillText(maxValue.toString(), rightX, rightY);
    }
}
中心文字的设计需要考虑可读性和信息层次。主数值使用最大字号和最深的颜色,是视觉焦点。标签文字使用较小的字号和较浅的颜色,提供上下文信息。百分比符号的位置和大小都经过调整,与主数值形成协调的视觉比例。
3.6 完整渲染流程
将所有绘制步骤整合在一起,形成完整的渲染流程。
class GaugeChart {
    // 完整的渲染流程
    render() {
        // 计算布局参数
        this.calculateLayout();

        // 清空画布
        this.ctx.clearRect(0, 0, this.width, this.height);

        // 绘制背景
        this.drawBackground();

        // 绘制多色弧线(参考)
        this.drawMultiColorArc();

        // 绘制渐变进度弧线
        const displayValue = this.targetValue;
        if (this.options.gradientColors) {
            this.drawGradientArc(displayValue);
        } else {
            this.drawSegmentedArc(displayValue);
        }

        // 绘制指针
        this.drawNeedle(displayValue);

        // 绘制中心文字
        this.drawCenterText(displayValue);
    }

    // 带动画的渲染
    renderAnimated() {
        if (!this.options.animate) {
            this.currentValue = this.targetValue;
            this.render();
            return;
        }

        const startTime = Date.now();
        const duration = this.options.animationDuration;
        const startValue = this.currentValue;
        const endValue = this.targetValue;

        const animate = () => {
            const elapsed = Date.now() - startTime;
            const progress = Math.min(elapsed / duration, 1);
            const easedProgress = this.easeOutCubic(progress);

            // 计算当前值(插值)
            this.currentValue = startValue + (endValue - startValue) * easedProgress;

            // 清空画布
            this.ctx.clearRect(0, 0, this.width, this.height);

            // 重新计算布局
            this.calculateLayout();

            // 绘制背景
            this.drawBackground();

            // 绘制多色弧线
            this.drawMultiColorArc();

            // 绘制进度弧线
            if (this.options.gradientColors) {
                this.drawGradientArc(this.currentValue);
            } else {
                this.drawSegmentedArc(this.currentValue);
            }

            // 绘制指针
            this.drawNeedle(this.currentValue);

            // 绘制中心文字
            this.drawCenterText(this.currentValue);

            if (progress < 1) {
                requestAnimationFrame(animate);
            }
        };

        requestAnimationFrame(animate);
    }

    // 更新数值
    updateValue(newValue) {
        this.targetValue = Math.max(this.options.minValue,
            Math.min(this.options.maxValue, newValue));

        this.renderAnimated();
    }

    // 缓动函数
    easeOutCubic(t) {
        return 1 - Math.pow(1 - t, 3);
    }
}
带动画的渲染流程通过插值计算实现平滑过渡。在每一帧中,根据动画进度计算当前值应该处于旧值和新值之间的什么位置,然后渲染这个中间状态。这种方法让指针的移动看起来自然流畅,不会出现跳跃。
4. 数据结构设计
4.1 输入数据格式
仪表盘的数据结构非常简单,只需要一个值和一个标签。
// 仪表盘的输入数据结构
const gaugeData = {
    value: 78,
    label: '完成度'
};

// 带单位的数据
const gaugeDataWithUnit = {
    value: 78.5,
    label: 'CPU使用率',
    unit: '%'
};

// 带范围的数据
const gaugeDataWithRange = {
    value: 220,
    label: '电压',
    min: 0,
    max: 400,
    unit: 'V'
};
4.2 数据验证
class GaugeChart {
    setData(data) {
        // 验证数据结构
        if (!data || typeof data !== 'object') {
            throw new Error('Invalid data: must be an object');
        }

        // 验证数值
        let value = Number(data.value);
        if (isNaN(value)) {
            throw new Error('Invalid data: value must be a number');
        }

        // 验证数值范围
        const minValue = data.minValue !== undefined ?
            Number(data.minValue) : this.options.minValue;
        const maxValue = data.maxValue !== undefined ?
            Number(data.maxValue) : this.options.maxValue;

        // 确保最小值小于最大值
        if (minValue >= maxValue) {
            throw new Error('Invalid data: minValue must be less than maxValue');
        }

        // 限制值在范围内
        value = Math.max(minValue, Math.min(maxValue, value));

        this.data = {
            value: value,
            label: data.label || '',
            unit: data.unit || '',
            minValue: minValue,
            maxValue: maxValue
        };

        // 更新配置
        this.options.minValue = minValue;
        this.options.maxValue = maxValue;

        // 设置当前值
        this.targetValue = value;
        this.currentValue = data.initValue !== undefined ?
            data.initValue : minValue;
    }
}
5. 交互功能实现
5.1 点击设置数值
仪表盘可以作为输入控件,让用户通过点击来设置数值。
class GaugeChart {
    // 绑定事件
    bindEvents() {
        this.canvas.addEventListener('click', (e) => this.handleClick(e));
        this.canvas.addEventListener('dblclick', (e) => this.handleDoubleClick(e));
    }

    // 处理点击
    handleClick(e) {
        const rect = this.canvas.getBoundingClientRect();
        const x = e.clientX - rect.left;
        const y = e.clientY - rect.top;

        // 检查是否在仪表盘范围内
        const dx = x - this.centerX;
        const dy = y - this.centerY;
        const distance = Math.sqrt(dx * dx + dy * dy);

        if (distance > this.radius * 1.2 || distance < this.radius * 0.3) {
            return;  // 点击位置不在有效范围内
        }

        // 计算点击位置的角度
        let angle = Math.atan2(dy, dx);

        // 标准化角度到起始角度
        while (angle < this.startAngle) angle += Math.PI * 2;
        while (angle > this.endAngle) angle -= Math.PI * 2;

        // 转换为数值
        const value = this.angleToValue(angle);

        // 更新数值
        this.updateValue(value);

        // 触发回调
        if (this.options.onClick) {
            this.options.onClick(value);
        }
    }

    // 处理双击重置
    handleDoubleClick(e) {
        // 重置到默认值
        const defaultValue = (this.options.maxValue + this.options.minValue) / 2;
        this.updateValue(defaultValue);
    }
}
点击交互的设计需要考虑用户体验。用户点击仪表盘上的某个位置,系统计算该位置对应的数值,然后将指针动画移动到该位置。这种交互方式直观自然,特别适合需要快速调整数值的场景,如亮度调节、音量调节等。
5.2 拖拽设置数值
除了点击,拖拽是一种更加精细的数值调整方式。
class GaugeChart {
    // 绑定拖拽事件
    bindDragEvents() {
        this.isDragging = false;

        this.canvas.addEventListener('mousedown', (e) => this.handleDragStart(e));
        this.canvas.addEventListener('mousemove', (e) => this.handleDragMove(e));
        this.canvas.addEventListener('mouseup', (e) => this.handleDragEnd(e));
        this.canvas.addEventListener('mouseleave', (e) => this.handleDragEnd(e));
    }

    // 开始拖拽
    handleDragStart(e) {
        const rect = this.canvas.getBoundingClientRect();
        const x = e.clientX - rect.left;
        const y = e.clientY - rect.top;

        // 检查是否在仪表盘范围内
        const dx = x - this.centerX;
        const dy = y - this.centerY;
        const distance = Math.sqrt(dx * dx + dy * dy);

        if (distance >= this.radius * 0.3 && distance <= this.radius * 1.2) {
            this.isDragging = true;
            this.canvas.style.cursor = 'grabbing';
            this.updateValueFromMouse(e);
        }
    }

    // 拖拽移动
    handleDragMove(e) {
        if (!this.isDragging) return;
        this.updateValueFromMouse(e);
    }

    // 结束拖拽
    handleDragEnd(e) {
        if (this.isDragging) {
            this.isDragging = false;
            this.canvas.style.cursor = 'pointer';
        }
    }

    // 根据鼠标位置更新数值
    updateValueFromMouse(e) {
        const rect = this.canvas.getBoundingClientRect();
        const x = e.clientX - rect.left;
        const y = e.clientY - rect.top;

        // 计算角度
        let angle = Math.atan2(y - this.centerY, x - this.centerX);

        // 标准化到弧度范围
        if (angle < 0) angle += Math.PI * 2;

        // 检查角度是否在有效范围内
        if (angle >= this.startAngle && angle <= this.endAngle) {
            const value = this.angleToValue(angle);
            this.targetValue = value;
            this.currentValue = value;
            this.render();
        }
    }
}
拖拽交互需要实时响应鼠标移动。在拖拽过程中,每次鼠标移动都重新计算角度和数值,然后立即渲染更新。这种即时反馈让用户能够精确控制数值,达到目标值后松开鼠标即可。
6. 高级功能
6.1 多指针仪表盘
有时需要在一个仪表盘中显示多个指针,比如同时显示"当前值"和"目标值"。
class GaugeChart {
    // 绘制多指针
    drawMultipleNeedles(needles) {
        needles.forEach((needle, index) => {
            this.drawSingleNeedle(needle.value, needle.color, index);
        });
    }

    // 绘制单个指针
    drawSingleNeedle(value, color, zIndex = 0) {
        const ctx = this.ctx;
        const valueAngle = this.valueToAngle(value);
        const needleLength = this.radius - this.options.arcWidth / 2 - 10;

        ctx.beginPath();
        ctx.moveTo(
            this.centerX + Math.cos(valueAngle) * needleLength,
            this.centerY + Math.sin(valueAngle) * needleLength
        );
        ctx.lineTo(this.centerX, this.centerY);
        ctx.strokeStyle = color;
        ctx.lineWidth = 4;
        ctx.lineCap = 'round';
        ctx.stroke();
    }

    // 绘制中心装饰环
    drawCenterRing() {
        const ctx = this.ctx;
        const ringRadius = 20;

        ctx.beginPath();
        ctx.arc(this.centerX, this.centerY, ringRadius, 0, Math.PI * 2);
        ctx.strokeStyle = 'rgba(255, 255, 255, 0.2)';
        ctx.lineWidth = 2;
        ctx.stroke();
    }
}
6.2 刻度细分
在某些精密场景中,需要更细的刻度来提供精确的读数参考。
class GaugeChart {
    // 绘制细分刻度
    drawMinorTicks() {
        const ctx = this.ctx;
        const { minValue, maxValue, tickCount } = this.options;

        // 计算细分刻度的数量(每个主刻度之间5个细分刻度)
        const minorTicksPerMajor = 5;
        const totalMinorTicks = tickCount * minorTicksPerMajor;
        const valueRange = maxValue - minValue;
        const minorTickStep = valueRange / totalMinorTicks;

        const innerRadius = this.radius - this.options.arcWidth / 2 - 3;
        const minorTickLength = 4;

        for (let i = 0; i <= totalMinorTicks; i++) {
            // 跳过主刻度的位置
            if (i % minorTicksPerMajor === 0) continue;

            const value = minValue + i * minorTickStep;
            const angle = this.valueToAngle(value);

            const startX = this.centerX + Math.cos(angle) * innerRadius;
            const startY = this.centerY + Math.sin(angle) * innerRadius;
            const endX = this.centerX + Math.cos(angle) * (innerRadius - minorTickLength);
            const endY = this.centerY + Math.sin(angle) * (innerRadius - minorTickLength);

            ctx.beginPath();
            ctx.moveTo(startX, startY);
            ctx.lineTo(endX, endY);
            ctx.strokeStyle = 'rgba(255, 255, 255, 0.2)';
            ctx.lineWidth = 1;
            ctx.stroke();
        }
    }
}
6.3 动态区间阈值
在一些高级应用中,颜色区间的阈值可能需要根据实际情况动态调整。
class GaugeChart {
    // 设置动态阈值
    setDynamicThresholds(thresholds) {
        this.options.dynamicThresholds = thresholds;
        this.render();
    }

    // 获取动态颜色
    getDynamicColor(value) {
        const thresholds = this.options.dynamicThresholds;
        if (!thresholds) {
            return this.getValueColor(value);
        }

        // 遍历阈值找到匹配的颜色
        for (let i = thresholds.length - 1; i >= 0; i--) {
            if (value >= thresholds[i].min) {
                return thresholds[i].color;
            }
        }

        return this.options.colors.low;
    }
}
7. 实际应用示例
7.1 项目进度展示
const progressGauge = new GaugeChart('progressGauge', {
    value: 68,
    label: '项目进度'
}, {
    colors: {
        low: '#ef4444',
        medium: '#f59e0b',
        high: '#22c55e'
    },
    animationDuration: 1200,
    showTicks: true,
    tickCount: 10
});

// 模拟进度更新
setInterval(() => {
    const newValue = Math.min(100, progressGauge.targetValue + Math.random() * 2);
    progressGauge.updateValue(newValue);
}, 3000);
7.2 系统监控仪表
const cpuGauge = new GaugeChart('cpuGauge', {
    value: 45,
    label: 'CPU'
}, {
    colors: {
        low: '#22c55e',    // 0-60%: 绿色(正常)
        medium: '#f59e0b',  // 60-85%: 黄色(警告)
        high: '#ef4444'     // 85-100%: 红色(危险)
    },
    minValue: 0,
    maxValue: 100,
    showTicks: true,
    tickCount: 10
});
7.3 环形仪表盘变体
// 创建环形仪表盘(360度)
const ringGauge = new GaugeChart('ringGauge', {
    value: 75,
    label: '完成度'
}, {
    startAngle: -Math.PI / 2,  // 从12点钟方向开始
    endAngle: Math.PI * 1.5,   // 到9点钟方向结束(270度)
    arcWidth: 20,
    showTicks: false,
    showLabels: false
});
8. 性能优化
8.1 缓存不变元素
仪表盘的背景弧线和刻度是静态的,可以缓存到离屏Canvas中。
class GaugeChart {
    constructor() {
        this.offscreenCanvas = document.createElement('canvas');
        this.offscreenCtx = this.offscreenCanvas.getContext('2d');
        this.backgroundCacheValid = false;
    }

    // 绘制背景到缓存
    drawBackgroundToCache() {
        if (this.backgroundCacheValid) return;

        const ctx = this.offscreenCtx;
        this.offscreenCanvas.width = this.width * this.dpr;
        this.offscreenCanvas.height = this.height * this.dpr;
        ctx.scale(this.dpr, this.dpr);

        // 临时替换上下文
        const mainCtx = this.ctx;
        this.ctx = ctx;

        // 绘制背景元素
        this.drawBackground();
        this.drawMultiColorArc();

        // 恢复上下文
        this.ctx = mainCtx;

        this.backgroundCacheValid = true;
    }

    // 使用缓存渲染
    renderWithCache() {
        this.calculateLayout();

        // 清空画布
        this.ctx.clearRect(0, 0, this.width, this.height);

        // 绘制缓存的背景
        this.drawBackgroundToCache();
        this.ctx.drawImage(this.offscreenCanvas, 0, 0, this.width, this.height);

        // 绘制动态元素
        this.drawGradientArc(this.currentValue);
        this.drawNeedle(this.currentValue);
        this.drawCenterText(this.currentValue);
    }
}
9. 总结
本文详细介绍了仪表盘图表组件的完整实现过程,涵盖以下核心知识点:
-
弧度计算原理:理解仪表盘的角度范围设计,掌握数值与角度之间的映射关系。
-
渐变弧线绘制:实现从绿色到黄色到红色的渐变效果,或分段颜色的精确控制。
-
指针设计:掌握三角形指针的几何绘制,理解指针颜色与当前值的关联。
-
中心文字渲染:设计清晰的信息层次,让用户快速获取关键数值。
-
动画效果实现:通过插值和缓动函数实现指针和弧线的平滑过渡动画。
-
交互功能:实现点击和拖拽来设置数值,增强用户体验。
-
性能优化:利用离屏Canvas缓存静态背景,减少重复绘制。
仪表盘图表是一种直观、高效的数据可视化形式,特别适合展示单一指标的当前状态和完成进度。通过本文的学习,读者应该能够掌握仪表盘的核心实现原理,并将其应用到监控仪表板、数据仪表盘等实际项目中。

讨论HarmonyOS开发技术,专注于API与组件、DevEco Studio、测试、元服务和应用上架分发等。
更多推荐


 0
0 0
0- 0


 已为社区贡献79条内容

所有评论(0)