Harmonyos应用实例198:随机变量与分布
·
10. 随机变量与分布
功能简介:展示常见离散型随机变量的分布,如二项分布、泊松分布等,计算期望和方差。离散型随机变量分布功能支持二项分布、泊松分布和几何分布三种常见离散型概率分布,可通过滑块调整试验次数、成功概率、速率参数等关键参数,实时计算并显示期望和方差,同时绘制概率质量函数(PMF)柱状图,直观展示概率分布形态。界面设计清晰,支持动态参数调整和实时结果更新,帮助用户理解不同离散型分布的特性和统计规律,是学习概率统计的理想工具。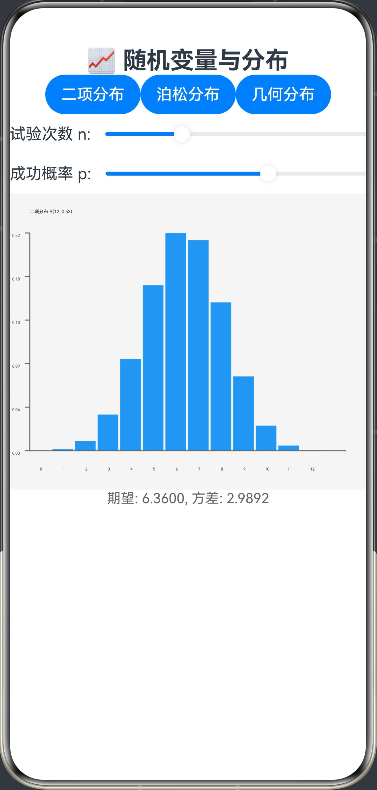
ArkTS代码:
interface PMFData {
  x: number
  p: number
}

@Entry
@Component
struct RandomVariable {
  @State private distribution: string = 'binomial'
  @State private parameters: number[] = [10, 0.5]
  @State private statistics: string = ''
  @State private pmfData: PMFData[] = []
  private settings: RenderingContextSettings = new RenderingContextSettings(true)
  private context: CanvasRenderingContext2D = new CanvasRenderingContext2D(this.settings)

  build() {
    Column() {
      Text('📈 随机变量与分布')
        .fontSize(24).fontWeight(FontWeight.Bold)

      Row() {
        Button('二项分布').onClick(() => {
          this.distribution = 'binomial'
          this.parameters = [10, 0.5]
          this.calculateStatistics()
        })
        Button('泊松分布').onClick(() => {
          this.distribution = 'poisson'
          this.parameters = [5, 0]
          this.calculateStatistics()
        })
        Button('几何分布').onClick(() => {
          this.distribution = 'geometric'
          this.parameters = [0.5, 0]
          this.calculateStatistics()
        })
      }

      ForEach([0, 1], (index: number) => {
        if (!((this.distribution === 'poisson' || this.distribution === 'geometric') && index === 1)) {
          Row() {
            Text(this.getParameterLabel(index))
            Slider({
              value: this.parameters[index],
              min: this.getMinValue(index),
              max: this.getMaxValue(index),
              step: this.getStepValue(index)
            })
              .onChange((val: number) => {
                this.parameters[index] = val
                this.calculateStatistics()
              })
          }
        }
      })

      Canvas(this.context)
        .width(400).height(300)
        .onReady(() => this.drawDistribution(this.context))

      Text(this.statistics)
        .fontSize(14).fontColor('#666')
    }
  }

  private getParameterLabel(index: number): string {
    switch (this.distribution) {
      case 'binomial':
        return index === 0 ? '试验次数 n: ' : '成功概率 p: '
      case 'poisson':
        return 'λ (速率参数): '
      case 'geometric':
        return '成功概率 p: '
      default:
        return ''
    }
  }

  private getMinValue(index: number): number {
    switch (this.distribution) {
      case 'binomial':
        return index === 0 ? 1 : 0.1
      case 'poisson':
        return 0.1
      case 'geometric':
        return 0.1
      default:
        return 0.1
    }
  }

  private getMaxValue(index: number): number {
    switch (this.distribution) {
      case 'binomial':
        return index === 0 ? 50 : 0.99
      case 'poisson':
        return 20
      case 'geometric':
        return 0.99
      default:
        return 20
    }
  }

  private getStepValue(index: number): number {
    switch (this.distribution) {
      case 'binomial':
        return index === 0 ? 1 : 0.01
      case 'poisson':
        return 0.1
      case 'geometric':
        return 0.01
      default:
        return 0.1
    }
  }

  private calculateStatistics() {
    let mean: number = 0
    let variance: number = 0
    this.pmfData = []

    switch (this.distribution) {
      case 'binomial':
        const n = Math.round(this.parameters[0])
        const p = this.parameters[1]
        mean = n * p
        variance = n * p * (1 - p)

        // 计算二项分布的PMF
        for (let k = 0; k <= n; k++) {
          const probability = this.binomialPMF(n, k, p)
          this.pmfData.push({x: k, p: probability})
        }
        break

      case 'poisson':
        const lambda = this.parameters[0]
        mean = lambda
        variance = lambda

        // 计算泊松分布的PMF
        for (let k = 0; k <= Math.min(20, Math.round(lambda * 3)); k++) {
          const probability = this.poissonPMF(lambda, k)
          this.pmfData.push({x: k, p: probability})
        }
        break

      case 'geometric':
        const p_geo = this.parameters[0]
        mean = 1 / p_geo
        variance = (1 - p_geo) / (p_geo * p_geo)

        // 计算几何分布的PMF
        for (let k = 1; k <= Math.min(20, Math.round(1 / p_geo * 3)); k++) {
          const probability = this.geometricPMF(p_geo, k)
          this.pmfData.push({x: k, p: probability})
        }
        break
    }

    this.statistics = `期望: ${mean.toFixed(4)}, 方差: ${variance.toFixed(4)}`
    this.drawDistribution(this.context)
  }

  private binomialPMF(n: number, k: number, p: number): number {
    return this.combination(n, k) * Math.pow(p, k) * Math.pow(1 - p, n - k)
  }

  private poissonPMF(lambda: number, k: number): number {
    return (Math.pow(lambda, k) * Math.exp(-lambda)) / this.factorial(k)
  }

  private geometricPMF(p: number, k: number): number {
    return Math.pow(1 - p, k - 1) * p
  }

  private combination(n: number, k: number): number {
    return this.factorial(n) / (this.factorial(k) * this.factorial(n - k))
  }

  private factorial(n: number): number {
    if (n === 0 || n === 1) return 1
    let result = 1
    for (let i = 2; i <= n; i++) {
      result *= i
    }
    return result
  }

  private drawDistribution(ctx: CanvasRenderingContext2D) {
    const width = 400
    const height = 300

    // 清空画布
    ctx.clearRect(0, 0, width, height)
    ctx.fillStyle = '#F5F5F5'
    ctx.fillRect(0, 0, width, height)

    if (this.pmfData.length === 0) return

    // 计算图表参数
    const padding = 40
    const chartWidth = width - padding * 2
    const chartHeight = height - padding * 2
    const maxProb = Math.max(...this.pmfData.map(item => item.p))
    const barWidth = chartWidth / (this.pmfData.length + 1)

    // 绘制PMF柱状图
    for (let i = 0; i < this.pmfData.length; i++) {
      const item = this.pmfData[i]
      const x = padding + (i + 0.5) * barWidth
      const barHeight = (item.p / maxProb) * chartHeight
      const y = height - padding - barHeight

      // 绘制柱子
      ctx.fillStyle = '#2196F3'
      ctx.fillRect(x - barWidth / 2, y, barWidth - 2, barHeight)

      // 绘制X轴标签
      ctx.fillStyle = '#333333'
      ctx.font = '12px sans-serif'
      ctx.textAlign = 'center'
      ctx.fillText(item.x.toString(), x, height - padding + 20)
    }

    // 绘制坐标轴
    ctx.strokeStyle = '#666666'
    ctx.lineWidth = 1
    ctx.beginPath()
    ctx.moveTo(padding, padding)
    ctx.lineTo(padding, height - padding)
    ctx.lineTo(width - padding, height - padding)
    ctx.stroke()

    // 绘制Y轴刻度
    ctx.textAlign = 'right'
    const yTicks = 5
    for (let i = 0; i <= yTicks; i++) {
      const y = height - padding - (i / yTicks) * chartHeight
      const value = (i / yTicks * maxProb).toFixed(2)

      ctx.beginPath()
      ctx.moveTo(padding, y)
      ctx.lineTo(padding - 5, y)
      ctx.stroke()

      ctx.fillText(value, padding - 10, y + 4)
    }

    // 绘制标题
    ctx.textAlign = 'left'
    ctx.font = '14px sans-serif'
    let title = ''
    switch (this.distribution) {
      case 'binomial':
        title = `二项分布 B(${Math.round(this.parameters[0])}, ${this.parameters[1].toFixed(2)})`
        break
      case 'poisson':
        title = `泊松分布 P(${this.parameters[0].toFixed(2)})`
        break
      case 'geometric':
        title = `几何分布 G(${this.parameters[0].toFixed(2)})`
        break
    }
    ctx.fillText(title, padding, 20)
  }
}

讨论HarmonyOS开发技术,专注于API与组件、DevEco Studio、测试、元服务和应用上架分发等。
更多推荐


 0
0 0
0- 0


 已为社区贡献400条内容

所有评论(0)