Harmonyos应用实例107:扇形统计图生成器
·
应用实例七:扇形统计图生成器
知识点:认识扇形统计图的特点,能从图中获取信息。
功能:学生输入几个项目的数据,应用自动计算各部分的百分比和圆心角,并动态绘制扇形统计图。点击扇形区域,显示该部分的具体数据和百分比。
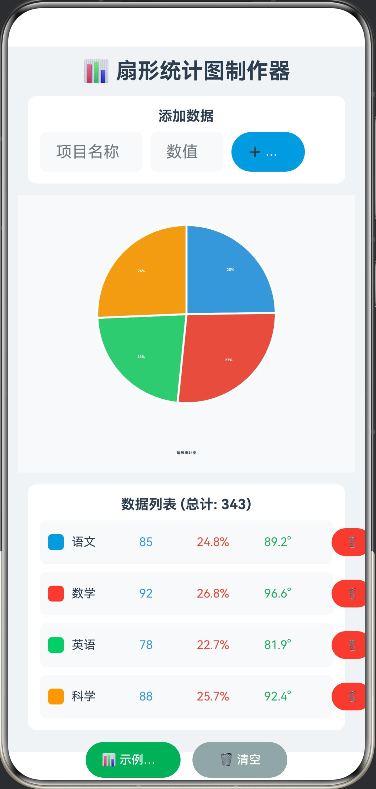
// PieChartApp.ets

interface DataItem {
  name: string
  value: number
  color: string
  percentage: number
  angle: number
}

@Entry
@Component
struct PieChartApp {
  private settings: RenderingContextSettings = new RenderingContextSettings(true)
  private context: CanvasRenderingContext2D = new CanvasRenderingContext2D(this.settings)

  @State private items: DataItem[] = []
  @State private inputName: string = ''
  @State private inputValue: string = ''
  @State private selectedIndex: number = -1
  @State private total: number = 0

  private readonly colors: string[] = ['#3498DB', '#E74C3C', '#2ECC71', '#F39C12', '#9B59B6', '#1ABC9C', '#E67E22', '#34495E']

  aboutToAppear(): void {
    this.addSampleData()
  }

  private addSampleData(): void {
    this.items = [
      { name: '语文', value: 85, color: this.colors[0], percentage: 0, angle: 0 },
      { name: '数学', value: 92, color: this.colors[1], percentage: 0, angle: 0 },
      { name: '英语', value: 78, color: this.colors[2], percentage: 0, angle: 0 },
      { name: '科学', value: 88, color: this.colors[3], percentage: 0, angle: 0 }
    ]
    this.calculateData()
  }

  private calculateData(): void {
    this.total = 0
    for (let i = 0; i < this.items.length; i++) {
      this.total += this.items[i].value
    }

    if (this.total > 0) {
      for (let i = 0; i < this.items.length; i++) {
        this.items[i].percentage = (this.items[i].value / this.total) * 100
        this.items[i].angle = (this.items[i].value / this.total) * 360
      }
    }

    this.drawPieChart()
  }

  private addItem(): void {
    if (!this.inputName || !this.inputValue) {
      return
    }

    const value = parseFloat(this.inputValue)
    if (isNaN(value) || value <= 0) {
      return
    }

    const colorIndex = this.items.length % this.colors.length
    const newItem: DataItem = {
      name: this.inputName,
      value: value,
      color: this.colors[colorIndex],
      percentage: 0,
      angle: 0
    }

    this.items.push(newItem)
    this.inputName = ''
    this.inputValue = ''
    this.calculateData()
  }

  private removeItem(index: number): void {
    this.items.splice(index, 1)
    this.selectedIndex = -1
    this.calculateData()
  }

  private clearAll(): void {
    this.items = []
    this.selectedIndex = -1
    this.total = 0
    this.drawPieChart()
  }

  build() {
    Column({ space: 12 }) {
      Text('📊 扇形统计图制作器')
        .fontSize(22)
        .fontWeight(FontWeight.Bold)
        .fontColor('#2C3E50')

      Column({ space: 8 }) {
        Text('添加数据')
          .fontSize(14)
          .fontWeight(FontWeight.Bold)
          .fontColor('#2C3E50')

        Row({ space: 8 }) {
          TextInput({
            placeholder: '项目名称',
            text: this.inputName
          })
            .width('35%')
            .height(40)
            .backgroundColor('#F8F9FA')
            .borderRadius(6)
            .onChange((value: string) => {
              this.inputName = value
            })

          TextInput({
            placeholder: '数值',
            text: this.inputValue
          })
            .width('25%')
            .height(40)
            .backgroundColor('#F8F9FA')
            .borderRadius(6)
            .type(InputType.Number)
            .onChange((value: string) => {
              this.inputValue = value
            })

          Button('➕ 添加')
            .fontSize(12)
            .height(40)
            .width('25%')
            .backgroundColor('#3498DB')
            .onClick(() => this.addItem())
        }
        .width('100%')
      }
      .width('95%')
      .padding(12)
      .backgroundColor('#FFFFFF')
      .borderRadius(8)

      Canvas(this.context)
        .width(340)
        .height(280)
        .backgroundColor('#F8F9FA')
        .borderRadius(8)
        .shadow({ radius: 3, color: '#00000010' })
        .onReady(() => {
          this.drawPieChart()
        })
        .onClick((event: ClickEvent) => {
          this.handleCanvasClick(event.x, event.y)
        })

      if (this.selectedIndex >= 0 && this.selectedIndex < this.items.length) {
        Column({ space: 8 }) {
          Text('📋 选中数据')
            .fontSize(14)
            .fontWeight(FontWeight.Bold)
            .fontColor('#2C3E50')

          Row({ space: 16 }) {
            Column({ space: 4 }) {
              Text('名称')
                .fontSize(11)
                .fontColor('#7F8C8D')
              Text(this.items[this.selectedIndex].name)
                .fontSize(16)
                .fontColor('#2C3E50')
                .fontWeight(FontWeight.Bold)
            }

            Column({ space: 4 }) {
              Text('数值')
                .fontSize(11)
                .fontColor('#7F8C8D')
              Text(`${this.items[this.selectedIndex].value}`)
                .fontSize(16)
                .fontColor('#3498DB')
                .fontWeight(FontWeight.Bold)
            }

            Column({ space: 4 }) {
              Text('百分比')
                .fontSize(11)
                .fontColor('#7F8C8D')
              Text(`${this.items[this.selectedIndex].percentage.toFixed(1)}%`)
                .fontSize(16)
                .fontColor('#E74C3C')
                .fontWeight(FontWeight.Bold)
            }

            Column({ space: 4 }) {
              Text('圆心角')
                .fontSize(11)
                .fontColor('#7F8C8D')
              Text(`${this.items[this.selectedIndex].angle.toFixed(1)}°`)
                .fontSize(16)
                .fontColor('#27AE60')
                .fontWeight(FontWeight.Bold)
            }
          }
          .width('100%')
          .justifyContent(FlexAlign.SpaceAround)
        }
        .width('95%')
        .padding(12)
        .backgroundColor('#FFF9C4')
        .borderRadius(8)
      }

      Column({ space: 8 }) {
        Text(`数据列表 (总计: ${this.total})`)
          .fontSize(14)
          .fontWeight(FontWeight.Bold)
          .fontColor('#2C3E50')

        if (this.items.length === 0) {
          Text('暂无数据,请添加项目')
            .fontSize(12)
            .fontColor('#95A5A6')
            .margin({ top: 8 })
        } else {
          ForEach(this.items, (item: DataItem, index: number) => {
            Row({ space: 8 }) {
              Row()
                .width(16)
                .height(16)
                .backgroundColor(item.color)
                .borderRadius(4)

              Text(item.name)
                .fontSize(12)
                .fontColor('#2C3E50')
                .width(60)

              Text(`${item.value}`)
                .fontSize(12)
                .fontColor('#3498DB')
                .width(50)

              Text(`${item.percentage.toFixed(1)}%`)
                .fontSize(12)
                .fontColor('#E74C3C')
                .width(60)

              Text(`${item.angle.toFixed(1)}°`)
                .fontSize(12)
                .fontColor('#27AE60')
                .width(60)

              Button('🗑️')
                .fontSize(10)
                .height(28)
                .width(40)
                .backgroundColor('#E74C3C')
                .onClick(() => this.removeItem(index))
            }
            .width('100%')
            .padding(8)
            .backgroundColor(index === this.selectedIndex ? '#EBF5FB' : '#F8F9FA')
            .borderRadius(6)
            .onClick(() => {
              this.selectedIndex = index
              this.drawPieChart()
            })
          })
        }
      }
      .width('95%')
      .padding(12)
      .backgroundColor('#FFFFFF')
      .borderRadius(8)

      Row({ space: 12 }) {
        Button('📊 示例数据')
          .fontSize(12)
          .height(36)
          .width('30%')
          .backgroundColor('#27AE60')
          .onClick(() => this.addSampleData())

        Button('🗑️ 清空')
          .fontSize(12)
          .height(36)
          .width('30%')
          .backgroundColor('#95A5A6')
          .onClick(() => this.clearAll())
      }
      .width('95%')
      .justifyContent(FlexAlign.Center)

      Column() {
        Text('💡 使用说明')
          .fontSize(14)
          .fontWeight(FontWeight.Bold)
          .fontColor('#2C3E50')

        Text('• 输入项目名称和数值,点击"添加"按钮')
          .fontSize(11)
          .fontColor('#7F8C8D')
          .margin({ top: 4 })

        Text('• 应用自动计算百分比和圆心角')
          .fontSize(11)
          .fontColor('#7F8C8D')
          .margin({ top: 2 })

        Text('• 点击扇形区域查看详细数据')
          .fontSize(11)
          .fontColor('#7F8C8D')
          .margin({ top: 2 })

        Text('• 扇形面积大小与数值成正比')
          .fontSize(11)
          .fontColor('#3498DB')
          .margin({ top: 2 })
      }
      .width('95%')
      .padding(12)
      .backgroundColor('#EBF5FB')
      .borderRadius(8)
      .alignItems(HorizontalAlign.Start)
    }
    .width('100%')
    .height('100%')
    .backgroundColor('#F0F3F6')
    .padding(12)
  }

  private drawPieChart(): void {
    const ctx = this.context
    const w = 340
    const h = 280

    ctx.clearRect(0, 0, w, h)
    ctx.fillStyle = '#F8F9FA'
    ctx.fillRect(0, 0, w, h)

    if (this.items.length === 0 || this.total === 0) {
      ctx.fillStyle = '#95A5A6'
      ctx.font = '14px sans-serif'
      ctx.textAlign = 'center'
      ctx.fillText('暂无数据', w / 2, h / 2)
      return
    }

    const centerX = w / 2
    const centerY = h / 2 - 20
    const radius = 90

    let currentAngle = -Math.PI / 2

    for (let i = 0; i < this.items.length; i++) {
      const item = this.items[i]
      const sliceAngle = (item.angle * Math.PI) / 180

      ctx.beginPath()
      ctx.moveTo(centerX, centerY)
      ctx.arc(centerX, centerY, radius, currentAngle, currentAngle + sliceAngle)
      ctx.closePath()

      ctx.fillStyle = item.color
      ctx.fill()

      if (i === this.selectedIndex) {
        ctx.strokeStyle = '#2C3E50'
        ctx.lineWidth = 3
        ctx.stroke()
      } else {
        ctx.strokeStyle = '#FFFFFF'
        ctx.lineWidth = 2
        ctx.stroke()
      }

      const labelAngle = currentAngle + sliceAngle / 2
      const labelX = centerX + Math.cos(labelAngle) * (radius * 0.7)
      const labelY = centerY + Math.sin(labelAngle) * (radius * 0.7)

      ctx.fillStyle = '#FFFFFF'
      ctx.font = 'bold 11px sans-serif'
      ctx.textAlign = 'center'
      ctx.textBaseline = 'middle'
      ctx.fillText(`${item.percentage.toFixed(0)}%`, labelX, labelY)

      currentAngle += sliceAngle
    }

    ctx.fillStyle = '#2C3E50'
    ctx.font = 'bold 12px sans-serif'
    ctx.textAlign = 'center'
    ctx.fillText('扇形统计图', w / 2, h - 20)

    if (this.selectedIndex >= 0 && this.selectedIndex < this.items.length) {
      const selectedItem = this.items[this.selectedIndex]
      ctx.fillStyle = '#2C3E50'
      ctx.font = '11px sans-serif'
      ctx.fillText(`${selectedItem.name}: ${selectedItem.value} (${selectedItem.percentage.toFixed(1)}%)`, w / 2, h - 5)
    }
  }

  private handleCanvasClick(x: number, y: number): void {
    const w = 340
    const h = 280
    const centerX = w / 2
    const centerY = h / 2 - 20
    const radius = 90

    const dx = x - centerX
    const dy = y - centerY
    const distance = Math.sqrt(dx * dx + dy * dy)

    if (distance > radius) {
      this.selectedIndex = -1
      this.drawPieChart()
      return
    }

    let angle = Math.atan2(dy, dx)
    if (angle < -Math.PI / 2) {
      angle += Math.PI * 2
    }
    angle += Math.PI / 2
    if (angle >= Math.PI * 2) {
      angle -= Math.PI * 2
    }

    let currentAngle = 0
    for (let i = 0; i < this.items.length; i++) {
      const sliceAngle = (this.items[i].angle * Math.PI) / 180
      if (angle >= currentAngle && angle < currentAngle + sliceAngle) {
        this.selectedIndex = i
        this.drawPieChart()
        return
      }
      currentAngle += sliceAngle
    }

    this.selectedIndex = -1
    this.drawPieChart()
  }
}

讨论HarmonyOS开发技术,专注于API与组件、DevEco Studio、测试、元服务和应用上架分发等。
更多推荐



 0
0 0
0- 0


 已为社区贡献402条内容

所有评论(0)