HARMONYOS应用实例258:反比例函数图像
·
- 反比例函数图像
- 功能:绘制双曲线,点击图像上的点显示坐标,验证 xy=kxy=kxy=k 的恒等关系。
应用功能:
绘制反比例函数双曲线图像 y = k/x
可调节k值,范围从1到20
点击图像上的点显示坐标
验证 xy = k 的恒等关系
显示/隐藏网格、渐近线、乘积验证
快速设置k值按钮(k=2, k=6, k=12, k=18)
展示函数性质和图像特征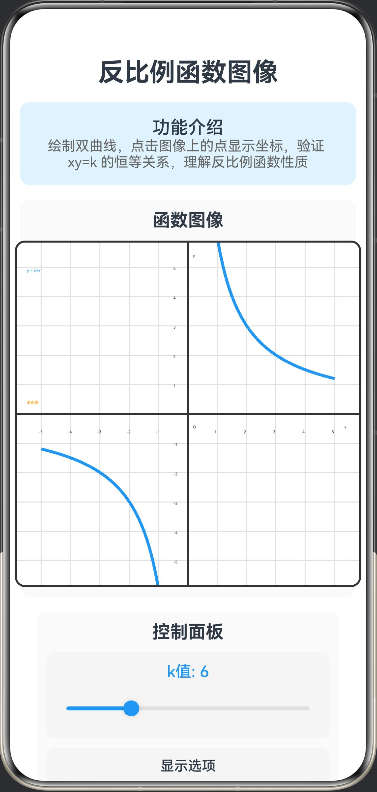
// 反比例函数图像
// 功能:绘制双曲线,点击图像上的点显示坐标,验证 xy=k 的恒等关系
// 点数据接口
interface PointData {
  x: number;
  y: number;
}

@Entry
@Component
struct InverseProportionFunction {
  @State kValue: number = 6;
  @State canvasWidth: number = 350;
  @State canvasHeight: number = 350;
  @State showGrid: boolean = true;
  @State showAsymptotes: boolean = true;
  @State selectedPoint: PointData | null = null;
  @State showProduct: boolean = true;

  build() {
    Column({ space: 15 }) {
      Text('反比例函数图像')
        .fontSize(26)
        .fontWeight(FontWeight.Bold)
        .textAlign(TextAlign.Center)

      Column() {
        Text('功能介绍')
          .fontSize(18)
          .fontWeight(FontWeight.Medium)
        Text('绘制双曲线,点击图像上的点显示坐标,验证 xy=k 的恒等关系,理解反比例函数性质')
          .fontSize(14)
          .fontColor('#666666')
          .textAlign(TextAlign.Center)
      }
      .width('100%')
      .backgroundColor('#E3F2FD')
      .borderRadius(10)
      .padding(15)

      Column({ space: 10 }) {
        Text('函数图像')
          .fontSize(18)
          .fontWeight(FontWeight.Bold)
          .width('100%')
          .textAlign(TextAlign.Center)

        Canvas(this.canvasContext)
          .width(this.canvasWidth)
          .height(this.canvasHeight)
          .backgroundColor('#FFFFFF')
          .border({ width: 2, color: '#333' })
          .borderRadius(10)
          .onReady(() => {
            this.drawGraph()
          })
          .gesture(
            GestureGroup(GestureMode.Exclusive,
              TapGesture()
                .onAction((event) => {
                  this.handleCanvasClick(event.fingerList[0].localX, event.fingerList[0].localY)
                })
            )
          )
      }
      .width('100%')
      .padding(10)
      .backgroundColor('#FAFAFA')
      .borderRadius(10)

      Column({ space: 10 }) {
        Text('控制面板')
          .fontSize(18)
          .fontWeight(FontWeight.Bold)
          .width('100%')
          .textAlign(TextAlign.Center)

        Column({ space: 8 }) {
          Text(`k值: ${this.kValue}`)
            .fontSize(16)
            .fontWeight(FontWeight.Medium)
            .fontColor('#2196F3')

          Slider({
            value: this.kValue,
            min: 1,
            max: 20,
            step: 1,
            style: SliderStyle.OutSet
          })
            .width('100%')
            .blockColor('#2196F3')
            .trackColor('#E0E0E0')
            .selectedColor('#2196F3')
            .onChange((value: number) => {
              this.kValue = value
              this.selectedPoint = null
              this.drawGraph()
            })
        }
        .width('100%')
        .padding(10)
        .backgroundColor('#F5F5F5')
        .borderRadius(8)

        Column({ space: 8 }) {
          Text('显示选项')
            .fontSize(14)
            .fontWeight(FontWeight.Medium)

          Row({ space: 10 }) {
            Row({ space: 5 }) {
              Text('显示网格')
                .fontSize(14)
              Text(this.showGrid ? '✓' : '✗')
                .fontSize(14)
                .fontColor(this.showGrid ? '#4CAF50' : '#F44336')
            }
            .onClick(() => {
              this.showGrid = !this.showGrid
              this.drawGraph()
            })

            Row({ space: 5 }) {
              Text('显示渐近线')
                .fontSize(14)
              Text(this.showAsymptotes ? '✓' : '✗')
                .fontSize(14)
                .fontColor(this.showAsymptotes ? '#4CAF50' : '#F44336')
            }
            .onClick(() => {
              this.showAsymptotes = !this.showAsymptotes
              this.drawGraph()
            })

            Row({ space: 5 }) {
              Text('显示乘积')
                .fontSize(14)
              Text(this.showProduct ? '✓' : '✗')
                .fontSize(14)
                .fontColor(this.showProduct ? '#4CAF50' : '#F44336')
            }
            .onClick(() => {
              this.showProduct = !this.showProduct
              this.drawGraph()
            })
          }
          .width('100%')
          .justifyContent(FlexAlign.SpaceAround)
        }
        .width('100%')
        .padding(10)
        .backgroundColor('#F5F5F5')
        .borderRadius(8)

        Row({ space: 10 }) {
          Button('k=2')
            .width('23%')
            .height(40)
            .fontSize(14)
            .backgroundColor('#4CAF50')
            .onClick(() => {
              this.kValue = 2
              this.selectedPoint = null
              this.drawGraph()
            })

          Button('k=6')
            .width('23%')
            .height(40)
            .fontSize(14)
            .backgroundColor('#2196F3')
            .onClick(() => {
              this.kValue = 6
              this.selectedPoint = null
              this.drawGraph()
            })

          Button('k=12')
            .width('23%')
            .height(40)
            .fontSize(14)
            .backgroundColor('#FF9800')
            .onClick(() => {
              this.kValue = 12
              this.selectedPoint = null
              this.drawGraph()
            })

          Button('k=18')
            .width('23%')
            .height(40)
            .fontSize(14)
            .backgroundColor('#9C27B0')
            .onClick(() => {
              this.kValue = 18
              this.selectedPoint = null
              this.drawGraph()
            })
        }
        .width('100%')
      }
      .width('90%')
      .padding(10)
      .backgroundColor('#FAFAFA')
      .borderRadius(10)

      if (this.selectedPoint !== null) {
        Column({ space: 10 }) {
          Text('选中点信息')
            .fontSize(18)
            .fontWeight(FontWeight.Bold)
            .width('100%')
            .textAlign(TextAlign.Center)

          Column({ space: 8 }) {
            Text(`坐标: (${this.selectedPoint.x.toFixed(2)}, ${this.selectedPoint.y.toFixed(2)})`)
              .fontSize(16)
              .fontColor('#2196F3')

            Text(`x × y = ${this.selectedPoint.x.toFixed(2)} × ${this.selectedPoint.y.toFixed(2)} = ${(this.selectedPoint.x * this.selectedPoint.y).toFixed(2)}`)
              .fontSize(16)
              .fontColor('#4CAF50')

            Text(`验证: xy = k = ${this.kValue}`)
              .fontSize(14)
              .fontColor('#666666')

            if (Math.abs(this.selectedPoint.x * this.selectedPoint.y - this.kValue) < 0.1) {
              Text('✓ 验证通过!')
                .fontSize(14)
                .fontColor('#4CAF50')
                .fontWeight(FontWeight.Bold)
            }
          }
          .width('100%')
          .padding(15)
          .backgroundColor('#E8F5E9')
          .borderRadius(10)
        }
        .width('100%')
        .padding(10)
        .backgroundColor('#FAFAFA')
        .borderRadius(10)
      }

      Column({ space: 10 }) {
        Text('函数性质')
          .fontSize(18)
          .fontWeight(FontWeight.Bold)
          .width('100%')
          .textAlign(TextAlign.Center)

        Column({ space: 8 }) {
          Text(`函数表达式: y = ${this.kValue}/x`)
            .fontSize(16)
            .fontColor('#2196F3')
            .textAlign(TextAlign.Center)

          Text(`定义域: x ≠ 0`)
            .fontSize(14)
            .fontColor('#666666')

          Text(`值域: y ≠ 0`)
            .fontSize(14)
            .fontColor('#666666')

          if (this.kValue > 0) {
            Text(`图像位置: 第一、三象限`)
              .fontSize(14)
              .fontColor('#4CAF50')
            Text(`增减性: 在每个象限内,y随x增大而减小`)
              .fontSize(14)
              .fontColor('#666666')
          } else {
            Text(`图像位置: 第二、四象限`)
              .fontSize(14)
              .fontColor('#F44336')
            Text(`增减性: 在每个象限内,y随x增大而增大`)
              .fontSize(14)
              .fontColor('#666666')
          }

          Text(`对称性: 关于原点中心对称`)
            .fontSize(14)
            .fontColor('#666666')

          Text(`渐近线: x轴和y轴`)
            .fontSize(14)
            .fontColor('#666666')
        }
        .width('100%')
        .padding(15)
        .backgroundColor('#E8F5E9')
        .borderRadius(10)
      }
      .width('100%')
      .padding(10)
      .backgroundColor('#FAFAFA')
      .borderRadius(10)

      Column({ space: 8 }) {
        Text('使用说明')
          .fontSize(16)
          .fontWeight(FontWeight.Bold)

        Text('• 滑动k值滑块观察双曲线变化')
          .fontSize(14)
          .fontColor('#666666')

        Text('• 点击图像上的点查看坐标')
          .fontSize(14)
          .fontColor('#666666')

        Text('• 验证 xy = k 的恒等关系')
          .fontSize(14)
          .fontColor('#666666')

        Text('• 观察双曲线的对称性和渐近线')
          .fontSize(14)
          .fontColor('#666666')

        Text('• k>0时图像在一、三象限')
          .fontSize(14)
          .fontColor('#666666')
      }
      .width('95%')
      .padding(12)
      .backgroundColor('#FFF3E0')
      .borderRadius(10)

      Row({ space: 10 }) {
        Button('重置')
          .width('100%')
          .height(50)
          .fontSize(16)
          .backgroundColor('#FF9800')
          .onClick(() => {
            this.reset()
          })
      }
      .width('100%')
    }
    .width('100%')
    .height('100%')
    .padding(10)
    .justifyContent(FlexAlign.Start)
  }

  private canvasContext: CanvasRenderingContext2D = new CanvasRenderingContext2D();

  private drawGraph() {
    const ctx = this.canvasContext
    ctx.clearRect(0, 0, this.canvasWidth, this.canvasHeight)

    if (this.showGrid) {
      this.drawGridLines(ctx)
    }

    if (this.showAsymptotes) {
      this.drawAsymptotes(ctx)
    }

    this.drawAxes(ctx)
    this.drawHyperbola(ctx)

    if (this.selectedPoint !== null) {
      this.drawSelectedPoint(ctx)
    }
  }

  private drawGridLines(ctx: CanvasRenderingContext2D) {
    ctx.strokeStyle = '#E0E0E0'
    ctx.lineWidth = 1

    const centerX = this.canvasWidth / 2
    const centerY = this.canvasHeight / 2
    const scale = 30

    for (let i = -5; i <= 5; i++) {
      ctx.beginPath()
      ctx.moveTo(centerX + i * scale, 0)
      ctx.lineTo(centerX + i * scale, this.canvasHeight)
      ctx.stroke()
    }

    for (let i = -5; i <= 5; i++) {
      ctx.beginPath()
      ctx.moveTo(0, centerY + i * scale)
      ctx.lineTo(this.canvasWidth, centerY + i * scale)
      ctx.stroke()
    }
  }

  private drawAsymptotes(ctx: CanvasRenderingContext2D) {
    const centerX = this.canvasWidth / 2
    const centerY = this.canvasHeight / 2

    ctx.strokeStyle = '#FF9800'
    ctx.lineWidth = 1
    ctx.setLineDash([5, 5])

    ctx.beginPath()
    ctx.moveTo(centerX, 0)
    ctx.lineTo(centerX, this.canvasHeight)
    ctx.stroke()

    ctx.beginPath()
    ctx.moveTo(0, centerY)
    ctx.lineTo(this.canvasWidth, centerY)
    ctx.stroke()

    ctx.setLineDash([])

    ctx.fillStyle = '#FF9800'
    ctx.font = '12px sans-serif'
    ctx.fillText('渐近线', 10, centerY - 10)
  }

  private drawAxes(ctx: CanvasRenderingContext2D) {
    const centerX = this.canvasWidth / 2
    const centerY = this.canvasHeight / 2

    ctx.strokeStyle = '#333'
    ctx.lineWidth = 2

    ctx.beginPath()
    ctx.moveTo(centerX, 0)
    ctx.lineTo(centerX, this.canvasHeight)
    ctx.stroke()

    ctx.beginPath()
    ctx.moveTo(0, centerY)
    ctx.lineTo(this.canvasWidth, centerY)
    ctx.stroke()

    ctx.fillStyle = '#333'
    ctx.font = '12px sans-serif'
    ctx.fillText('x', this.canvasWidth - 15, centerY + 15)
    ctx.fillText('y', centerX + 5, 15)
    ctx.fillText('O', centerX + 5, centerY + 15)

    const scale = 30
    for (let i = -5; i <= 5; i++) {
      if (i !== 0) {
        ctx.fillText(i.toString(), centerX + i * scale - 3, centerY + 20)
        ctx.fillText((-i).toString(), centerX - 15, centerY + i * scale + 3)
      }
    }
  }

  private drawHyperbola(ctx: CanvasRenderingContext2D) {
    const centerX = this.canvasWidth / 2
    const centerY = this.canvasHeight / 2
    const scale = 30

    ctx.strokeStyle = '#2196F3'
    ctx.lineWidth = 3

    // 第一象限
    ctx.beginPath()
    for (let x = 0.1; x <= 5; x += 0.1) {
      const y = this.kValue / x
      const pixelX = centerX + x * scale
      const pixelY = centerY - y * scale

      if (x === 0.1) {
        ctx.moveTo(pixelX, pixelY)
      } else {
        ctx.lineTo(pixelX, pixelY)
      }
    }
    ctx.stroke()

    // 第三象限
    ctx.beginPath()
    for (let x = -5; x <= -0.1; x += 0.1) {
      const y = this.kValue / x
      const pixelX = centerX + x * scale
      const pixelY = centerY - y * scale

      if (x === -5) {
        ctx.moveTo(pixelX, pixelY)
      } else {
        ctx.lineTo(pixelX, pixelY)
      }
    }
    ctx.stroke()

    ctx.fillStyle = '#2196F3'
    ctx.font = '14px sans-serif'
    ctx.fillText(`y = ${this.kValue}/x`, 10, 30)
  }

  private drawSelectedPoint(ctx: CanvasRenderingContext2D) {
    if (this.selectedPoint === null) return

    const centerX = this.canvasWidth / 2
    const centerY = this.canvasHeight / 2
    const scale = 30

    const pixelX = centerX + this.selectedPoint.x * scale
    const pixelY = centerY - this.selectedPoint.y * scale

    ctx.fillStyle = '#FF5722'
    ctx.beginPath()
    ctx.arc(pixelX, pixelY, 8, 0, 2 * Math.PI)
    ctx.fill()

    ctx.strokeStyle = '#FF5722'
    ctx.lineWidth = 2
    ctx.stroke()

    if (this.showProduct) {
      ctx.strokeStyle = '#FF5722'
      ctx.lineWidth = 1
      ctx.setLineDash([3, 3])

      ctx.beginPath()
      ctx.moveTo(pixelX, centerY)
      ctx.lineTo(pixelX, pixelY)
      ctx.lineTo(centerX, pixelY)
      ctx.stroke()

      ctx.setLineDash([])

      ctx.fillStyle = '#FF5722'
      ctx.font = '12px sans-serif'
      ctx.fillText(`x=${this.selectedPoint.x.toFixed(2)}`, pixelX + 10, centerY + 15)
      ctx.fillText(`y=${this.selectedPoint.y.toFixed(2)}`, centerX + 5, pixelY - 5)
    }
  }

  private handleCanvasClick(x: number, y: number) {
    const centerX = this.canvasWidth / 2
    const centerY = this.canvasHeight / 2
    const scale = 30

    const mathX = (x - centerX) / scale
    const mathY = (centerY - y) / scale

    if (mathX !== 0) {
      const expectedY = this.kValue / mathX
      if (Math.abs(mathY - expectedY) < 0.5) {
        this.selectedPoint = { x: mathX, y: expectedY }
        this.drawGraph()
      }
    }
  }

  private reset() {
    this.kValue = 6
    this.showGrid = true
    this.showAsymptotes = true
    this.selectedPoint = null
    this.showProduct = true
    this.drawGraph()
  }
}

讨论HarmonyOS开发技术,专注于API与组件、DevEco Studio、测试、元服务和应用上架分发等。
更多推荐


 0
0 0
0- 0


 已为社区贡献400条内容

所有评论(0)