Harmonyos应用实例217:线性回归分析
·
9. 线性回归分析
功能简介:输入一组数据点,拟合线性回归直线,计算相关系数、斜率和截距,展示回归分析的应用。支持手动输入数据或生成随机数据,帮助学生理解线性回归的原理和应用。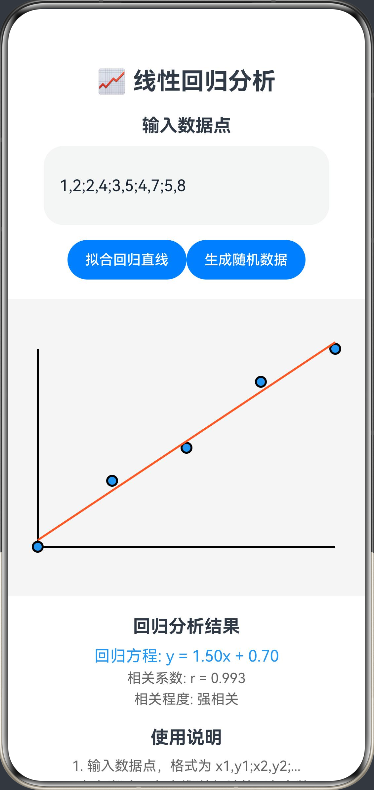
ArkTS代码:
@Entry
@Component
struct LinearRegression {
  @State private data: string = '1,2;2,4;3,5;4,7;5,8'
  @State private slope: number = 0
  @State private intercept: number = 0
  @State private correlation: number = 0
  private settings: RenderingContextSettings = new RenderingContextSettings(true)
  private context: CanvasRenderingContext2D = new CanvasRenderingContext2D(this.settings)

  build() {
    Column() {
      Text('📈 线性回归分析')
        .fontSize(24).fontWeight(FontWeight.Bold)
        .margin({ bottom: 20 })

      Text('输入数据点')
        .fontSize(18).fontWeight(FontWeight.Bold)
        .margin({ bottom: 10 })

      TextInput({
        placeholder: '输入数据点,格式: x1,y1;x2,y2;...',
        text: this.data
      })
        .width('90%')
        .height(80)
        .onChange((v: string) => this.data = v)

      Row() {
        Button('拟合回归直线')
          .width(120)
          .onClick(() => this.calculateRegression())
        Button('生成随机数据')
          .width(120)
          .onClick(() => this.generateRandomData())
      }
      .margin({ top: 15, bottom: 20 })

      Canvas(this.context)
        .width(400).height(300)
        .backgroundColor('#f5f5f5')
        .onReady(() => this.drawRegression())

      Text('回归分析结果')
        .fontSize(18).fontWeight(FontWeight.Bold)
        .margin({ top: 20, bottom: 10 })

      Text(`回归方程: y = ${this.slope.toFixed(2)}x + ${this.intercept.toFixed(2)}`)
        .fontSize(16).fontColor('#2196F3')
        .margin({ bottom: 5 })

      Text(`相关系数: r = ${this.correlation.toFixed(3)}`)
        .fontSize(14).fontColor('#666')
        .margin({ bottom: 5 })

      Text(`相关程度: ${this.getCorrelationStrength()}`)
        .fontSize(14).fontColor('#666')

      Text('使用说明')
        .fontSize(18).fontWeight(FontWeight.Bold)
        .margin({ top: 20, bottom: 10 })

      Text('1. 输入数据点,格式为 x1,y1;x2,y2;...')
        .fontSize(14).fontColor('#666')
        .margin({ bottom: 5 })

      Text('2. 点击"拟合回归直线"按钮计算回归参数')
        .fontSize(14).fontColor('#666')
        .margin({ bottom: 5 })

      Text('3. 点击"生成随机数据"按钮生成示例数据')
        .fontSize(14).fontColor('#666')
    }
    .padding(20)
  }

  private generateRandomData() {
    const points: string[] = []
    for (let i = 1; i <= 10; i++) {
      const y = 2 * i + Math.random() * 2 - 1
      points.push(`${i},${y.toFixed(1)}`)
    }
    this.data = points.join(';')
    this.calculateRegression()
  }

  private calculateRegression() {
    const points = this.data.split(';').map(p => p.split(',').map(Number))
    const n = points.length
    let sumX = 0, sumY = 0, sumXY = 0, sumX2 = 0

    for (let i = 0; i < points.length; i++) {
      const x = points[i][0]
      const y = points[i][1]
      sumX += x
      sumY += y
      sumXY += x * y
      sumX2 += x * x
    }

    this.slope = (n * sumXY - sumX * sumY) / (n * sumX2 - sumX * sumX)
    this.intercept = (sumY - this.slope * sumX) / n

    const meanX = sumX / n
    const meanY = sumY / n
    let numerator = 0, denominatorX = 0, denominatorY = 0

    for (let i = 0; i < points.length; i++) {
      const x = points[i][0]
      const y = points[i][1]
      numerator += (x - meanX) * (y - meanY)
      denominatorX += (x - meanX) * (x - meanX)
      denominatorY += (y - meanY) * (y - meanY)
    }

    this.correlation = numerator / Math.sqrt(denominatorX * denominatorY)
    this.drawRegression()
  }

  private drawRegression() {
    const ctx = this.context
    const width = 400
    const height = 300

    // 清空画布
    ctx.clearRect(0, 0, width, height)

    // 绘制坐标轴
    ctx.beginPath()
    ctx.moveTo(50, height - 50)
    ctx.lineTo(width - 50, height - 50)
    ctx.moveTo(50, 50)
    ctx.lineTo(50, height - 50)
    ctx.strokeStyle = '#000'
    ctx.stroke()

    // 解析数据点
    const points = this.data.split(';').map(p => p.split(',').map(Number))
    if (points.length === 0) return

    // 计算数据范围
    const xs = points.map(p => p[0])
    const ys = points.map(p => p[1])
    const minX = Math.min(...xs)
    const maxX = Math.max(...xs)
    const minY = Math.min(...ys)
    const maxY = Math.max(...ys)

    // 计算缩放因子
    const xScale = (width - 100) / (maxX - minX || 1)
    const yScale = (height - 100) / (maxY - minY || 1)

    // 绘制数据点
    points.forEach((point) => {
      const x = point[0]
      const y = point[1]
      const canvasX = 50 + (x - minX) * xScale
      const canvasY = height - 50 - (y - minY) * yScale

      ctx.beginPath()
      ctx.arc(canvasX, canvasY, 5, 0, 2 * Math.PI)
      ctx.fillStyle = '#2196F3'
      ctx.fill()
      ctx.strokeStyle = '#000'
      ctx.stroke()
    })

    // 绘制回归直线
    if (points.length >= 2) {
      const x1 = minX
      const y1 = this.slope * x1 + this.intercept
      const x2 = maxX
      const y2 = this.slope * x2 + this.intercept

      const canvasX1 = 50 + (x1 - minX) * xScale
      const canvasY1 = height - 50 - (y1 - minY) * yScale
      const canvasX2 = 50 + (x2 - minX) * xScale
      const canvasY2 = height - 50 - (y2 - minY) * yScale

      ctx.beginPath()
      ctx.moveTo(canvasX1, canvasY1)
      ctx.lineTo(canvasX2, canvasY2)
      ctx.strokeStyle = '#FF5722'
      ctx.lineWidth = 2
      ctx.stroke()
    }
  }

  private getCorrelationStrength(): string {
    const r = Math.abs(this.correlation)
    if (r >= 0.9) return '强相关'
    if (r >= 0.7) return '中等强相关'
    if (r >= 0.5) return '中等相关'
    if (r >= 0.3) return '弱相关'
    return '无相关'
  }
}

讨论HarmonyOS开发技术,专注于API与组件、DevEco Studio、测试、元服务和应用上架分发等。
更多推荐

 0
0 0
0- 0


 已为社区贡献400条内容

所有评论(0)