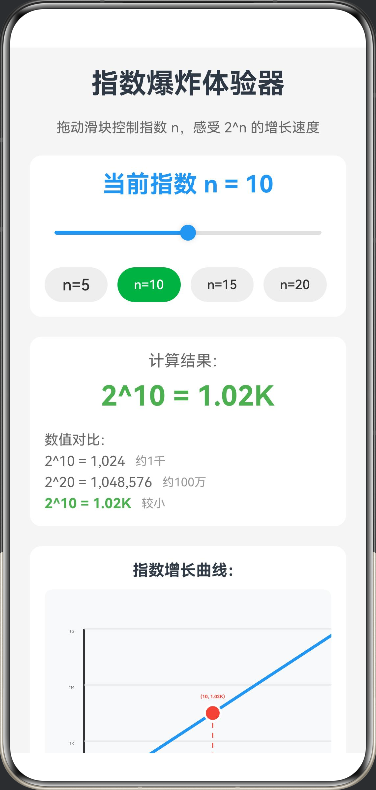
Harmonyos应用实例239:幂的运算规律
·
- 幂的运算规律
- 功能: 这是一个基于 HarmonyOS ArkTS 开发的交互式指数增长可视化应用,用户通过滑动条控制指数 n,实时展示 2^n 的增长速度曲线,直观体验指数爆炸的惊人效果。应用包含动态曲线图、数值对比和生活实例,帮助用户深入理解指数增长的数学原理和实际意义。
@Entry
@Component
struct ExponentialGrowth {
  // 状态变量:指数 n
  @State exponent: number = 10
  // 状态变量:计算结果 2^n
  @State result: number = Math.pow(2, 10)
  // 状态变量:是否显示折线图
  @State showChart: boolean = true
  // Canvas 上下文
  private settings: RenderingContextSettings = new RenderingContextSettings(true)
  private context: CanvasRenderingContext2D = new CanvasRenderingContext2D(this.settings)
  // 图表配置
  private chartWidth: number = 340
  private chartHeight: number = 250
  private maxExponent: number = 20

  build() {
    Scroll() {
      Column({ space: 20 }) {
        // 标题区
        Text('指数爆炸体验器')
          .fontSize(28)
          .fontWeight(FontWeight.Bold)

        Text('拖动滑块控制指数 n,感受 2^n 的增长速度')
          .fontSize(14)
          .fontColor('#666')

        // 指数控制区
        Column({ space: 15 }) {
          Text(`当前指数 n = ${this.exponent.toFixed(0)}`)
            .fontSize(24)
            .fontWeight(FontWeight.Bold)
            .fontColor('#2196F3')

          Slider({
            value: this.exponent,
            min: 0,
            max: this.maxExponent,
            step: 1
          })
            .width('100%')
            .height(40)
            .blockColor('#2196F3')
            .trackColor('#E0E0E0')
            .selectedColor('#2196F3')
            .onChange((value: number) => {
              this.exponent = value
              this.result = Math.pow(2, value)
              this.drawChart()
            })

          // 快速选择按钮
          Row({ space: 10 }) {
            Button('n=5')
              .width('22%')
              .height(35)
              .backgroundColor(this.exponent === 5 ? '#4CAF50' : '#EEEEEE')
              .fontColor(this.exponent === 5 ? '#FFFFFF' : '#333333')
              .onClick(() => {
                this.exponent = 5
                this.result = Math.pow(2, 5)
                this.drawChart()
              })

            Button('n=10')
              .width('22%')
              .height(35)
              .backgroundColor(this.exponent === 10 ? '#4CAF50' : '#EEEEEE')
              .fontColor(this.exponent === 10 ? '#FFFFFF' : '#333333')
              .onClick(() => {
                this.exponent = 10
                this.result = Math.pow(2, 10)
                this.drawChart()
              })

            Button('n=15')
              .width('22%')
              .height(35)
              .backgroundColor(this.exponent === 15 ? '#FF9800' : '#EEEEEE')
              .fontColor(this.exponent === 15 ? '#FFFFFF' : '#333333')
              .onClick(() => {
                this.exponent = 15
                this.result = Math.pow(2, 15)
                this.drawChart()
              })

            Button('n=20')
              .width('22%')
              .height(35)
              .backgroundColor(this.exponent === 20 ? '#F44336' : '#EEEEEE')
              .fontColor(this.exponent === 20 ? '#FFFFFF' : '#333333')
              .onClick(() => {
                this.exponent = 20
                this.result = Math.pow(2, 20)
                this.drawChart()
              })
          }
          .width('100%')
        }
        .width('100%')
        .padding(15)
        .backgroundColor('#FFFFFF')
        .borderRadius(12)

        // 结果显示区
        Column({ space: 10 }) {
          Text('计算结果:')
            .fontSize(16)
            .fontColor('#666')

          Text(`2^${this.exponent.toFixed(0)} = ${this.formatNumber(this.result)}`)
            .fontSize(28)
            .fontWeight(FontWeight.Bold)
            .fontColor(this.getResultColor())

          // 数值对比
          Column({ space: 5 }) {
            Text('数值对比:')
              .fontSize(14)
              .fontColor('#666')
              .margin({ top: 10 })

            Row({ space: 10 }) {
              Text('2^10 = 1,024')
                .fontSize(14)
                .fontColor('#666')
              Text('约1千')
                .fontSize(12)
                .fontColor('#999')
            }

            Row({ space: 10 }) {
              Text('2^20 = 1,048,576')
                .fontSize(14)
                .fontColor('#666')
              Text('约100万')
                .fontSize(12)
                .fontColor('#999')
            }

            Row({ space: 10 }) {
              Text(`2^${this.exponent.toFixed(0)} = ${this.formatNumber(this.result)}`)
                .fontSize(14)
                .fontWeight(FontWeight.Bold)
                .fontColor(this.getResultColor())
              Text(this.getComparisonText())
                .fontSize(12)
                .fontColor('#999')
            }
          }
          .width('100%')
          .alignItems(HorizontalAlign.Start)
        }
        .width('100%')
        .padding(15)
        .backgroundColor('#FFFFFF')
        .borderRadius(12)

        // 增长曲线图
        Column({ space: 10 }) {
          Text('指数增长曲线:')
            .fontSize(16)
            .fontWeight(FontWeight.Bold)

          Canvas(this.context)
            .width('100%')
            .height(280)
            .backgroundColor('#F8F9FA')
            .borderRadius(8)
            .onReady(() => {
              this.drawChart()
            })
        }
        .width('100%')
        .padding(15)
        .backgroundColor('#FFFFFF')
        .borderRadius(12)

        // 指数爆炸说明
        Column({ space: 10 }) {
          Text('什么是指数爆炸?')
            .fontSize(18)
            .fontWeight(FontWeight.Bold)

          Text('指数增长是指一个量以固定比例持续增长,其增长速度会随着时间呈指数级增加。2^n 表示将2自乘n次,当n增大时,结果会迅速变得极其庞大。')
            .fontSize(14)
            .fontColor('#666')

          Text('生活实例:')
            .fontSize(16)
            .fontWeight(FontWeight.Bold)
            .margin({ top: 10 })

          Column({ space: 5 }) {
            Text('• 棋盘放米:第64格需要放 2^63 粒米,约900亿吨')
              .fontSize(13)
              .fontColor('#666')
            Text('• 纸张对折:对折42次后厚度可达月球')
              .fontSize(13)
              .fontColor('#666')
            Text('• 病毒传播:指数级传播可在短时间内感染大量人群')
              .fontSize(13)
              .fontColor('#666')
          }
          .width('100%')
          .alignItems(HorizontalAlign.Start)
        }
        .width('100%')
        .padding(15)
        .backgroundColor('#FFF3E0')
        .borderRadius(12)

        // 重置按钮
        Button('重置')
          .width('100%')
          .height(40)
          .backgroundColor('#9E9E9E')
          .onClick(() => {
            this.exponent = 10
            this.result = Math.pow(2, 10)
            this.drawChart()
          })

      }
      .width('100%')
      .padding(20)
      .backgroundColor('#F5F5F5')
    }
    .width('100%')
    .height('100%')
  }

  // 绘制增长曲线
  private drawChart() {
    const ctx = this.context
    const width = this.chartWidth
    const height = this.chartHeight
    const padding = 40
    const chartWidth = width - padding * 2
    const chartHeight = height - padding * 2

    // 清空画布
    ctx.clearRect(0, 0, width, height)

    // 计算最大值(用于缩放)
    const maxValue = Math.pow(2, this.maxExponent)
    const logMax = Math.log2(maxValue)

    // 绘制坐标轴
    ctx.strokeStyle = '#333333'
    ctx.lineWidth = 2
    ctx.beginPath()
    // X轴
    ctx.moveTo(padding, height - padding)
    ctx.lineTo(width - padding, height - padding)
    // Y轴
    ctx.moveTo(padding, height - padding)
    ctx.lineTo(padding, padding)
    ctx.stroke()

    // 绘制X轴刻度和标签
    ctx.font = '12px sans-serif'
    ctx.textAlign = 'center'
    ctx.fillStyle = '#666666'
    for (let i = 0; i <= this.maxExponent; i += 5) {
      const x = padding + (i / this.maxExponent) * chartWidth
      ctx.beginPath()
      ctx.moveTo(x, height - padding)
      ctx.lineTo(x, height - padding + 5)
      ctx.stroke()
      ctx.fillText(`n=${i}`, x, height - padding + 20)
    }

    // 绘制Y轴标签(对数刻度)
    ctx.textAlign = 'right'
    ctx.fillStyle = '#666666'
    const yLabels = ['1', '1K', '1M', '1G']
    for (let i = 0; i < 4; i++) {
      const y = height - padding - (i / 3) * chartHeight
      ctx.fillText(yLabels[i], padding - 10, y + 4)
      // 网格线
      ctx.strokeStyle = '#E0E0E0'
      ctx.lineWidth = 1
      ctx.beginPath()
      ctx.moveTo(padding, y)
      ctx.lineTo(width - padding, y)
      ctx.stroke()
    }

    // 绘制指数曲线
    ctx.strokeStyle = '#2196F3'
    ctx.lineWidth = 3
    ctx.beginPath()
    for (let i = 0; i <= this.maxExponent; i += 0.1) {
      const value = Math.pow(2, i)
      const logValue = Math.log2(value)
      const x = padding + (i / this.maxExponent) * chartWidth
      const y = height - padding - (logValue / logMax) * chartHeight
      if (i === 0) {
        ctx.moveTo(x, y)
      } else {
        ctx.lineTo(x, y)
      }
    }
    ctx.stroke()

    // 绘制当前点
    const currentLogValue = Math.log2(this.result)
    const currentX = padding + (this.exponent / this.maxExponent) * chartWidth
    const currentY = height - padding - (currentLogValue / logMax) * chartHeight

    // 当前点圆圈
    ctx.beginPath()
    ctx.arc(currentX, currentY, 8, 0, Math.PI * 2)
    ctx.fillStyle = '#F44336'
    ctx.fill()
    ctx.strokeStyle = '#FFFFFF'
    ctx.lineWidth = 2
    ctx.stroke()

    // 绘制虚线连接到坐标轴
    ctx.strokeStyle = '#F44336'
    ctx.lineWidth = 1
    ctx.setLineDash([5, 5])
    ctx.beginPath()
    ctx.moveTo(currentX, currentY)
    ctx.lineTo(currentX, height - padding)
    ctx.stroke()
    ctx.setLineDash([])

    // 标签
    ctx.font = 'bold 14px sans-serif'
    ctx.textAlign = 'center'
    ctx.fillStyle = '#F44336'
    ctx.fillText(`(${this.exponent.toFixed(0)}, ${this.formatNumber(this.result)})`, currentX, currentY - 15)
  }

  // 格式化大数字
  private formatNumber(num: number): string {
    if (num >= 1000000000) {
      return (num / 1000000000).toFixed(2) + 'B'
    } else if (num >= 1000000) {
      return (num / 1000000).toFixed(2) + 'M'
    } else if (num >= 1000) {
      return (num / 1000).toFixed(2) + 'K'
    } else {
      return num.toFixed(0)
    }
  }

  // 获取结果颜色
  private getResultColor(): string {
    if (this.exponent <= 10) {
      return '#4CAF50'
    } else if (this.exponent <= 15) {
      return '#FF9800'
    } else {
      return '#F44336'
    }
  }

  // 获取对比文本
  private getComparisonText(): string {
    if (this.exponent <= 10) {
      return '较小'
    } else if (this.exponent <= 15) {
      return '中等'
    } else if (this.exponent <= 18) {
      return '很大'
    } else {
      return '巨大!'
    }
  }
}

讨论HarmonyOS开发技术,专注于API与组件、DevEco Studio、测试、元服务和应用上架分发等。
更多推荐


 0
0 0
0- 0


 已为社区贡献400条内容

所有评论(0)