HARMONYOS应用实例266:随机事件模拟器
·
- 随机事件模拟器
- 功能:模拟抛硬币、摸球实验,当实验次数趋向无穷大时,频率趋于稳定,验证概率的统计定义。
抛硬币实验:模拟抛硬币,观察正面和反面出现的频率
摸球实验:模拟从装有红、蓝、绿球的袋子中摸球,观察各颜色出现的频率
批量实验:可设置每次实验的次数(1-100次)
实时统计:显示各结果的次数和频率
频率变化曲线:绘制频率随实验次数变化的曲线图
验证大数定律:当实验次数增加时,频率趋于稳定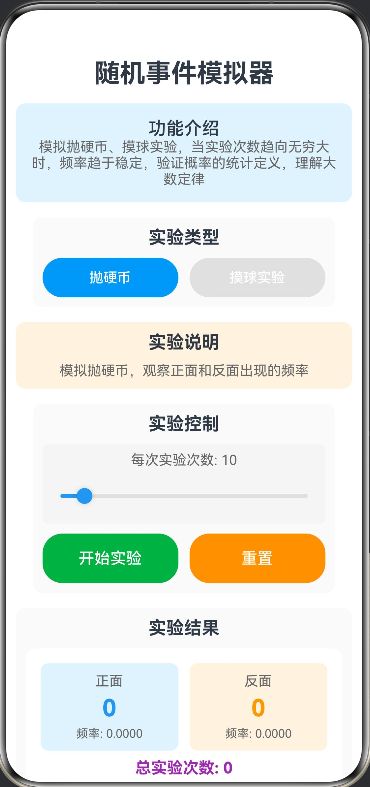
- 功能:模拟抛硬币、摸球实验,当实验次数趋向无穷大时,频率趋于稳定,验证概率的统计定义。
// 随机事件模拟器
// 功能:模拟抛硬币、摸球实验,当实验次数趋向无穷大时,频率趋于稳定,验证概率的统计定义

// 实验类型
interface ExperimentType {
  type: 'coin' | 'ball';
  name: string;
  description: string;
}

// 实验结果
interface ExperimentResult {
  heads: number;
  tails: number;
  red: number;
  blue: number;
  green: number;
  total: number;
}

// 频率记录
interface FrequencyRecord {
  heads: number;
  tails: number;
  red: number;
  blue: number;
  green: number;
}

@Entry
@Component
struct RandomEventSimulator {
  @State canvasWidth: number = 350;
  @State canvasHeight: number = 350;
  @State experimentType: ExperimentType = {
    type: 'coin',
    name: '抛硬币实验',
    description: '模拟抛硬币,观察正面和反面出现的频率'
  };
  @State experimentResult: ExperimentResult = {
    heads: 0,
    tails: 0,
    red: 0,
    blue: 0,
    green: 0,
    total: 0
  };
  @State batchSize: number = 10;
  @State isRunning: boolean = false;
  @State showAnimation: boolean = false;
  @State animationProgress: number = 0;
  @State frequencyHistory: FrequencyRecord[] = [];

  build() {
    Column({ space: 15 }) {
      Text('随机事件模拟器')
        .fontSize(26)
        .fontWeight(FontWeight.Bold)
        .textAlign(TextAlign.Center)

      Column() {
        Text('功能介绍')
          .fontSize(18)
          .fontWeight(FontWeight.Medium)
        Text('模拟抛硬币、摸球实验,当实验次数趋向无穷大时,频率趋于稳定,验证概率的统计定义,理解大数定律')
          .fontSize(14)
          .fontColor('#666666')
          .textAlign(TextAlign.Center)
      }
      .width('100%')
      .backgroundColor('#E3F2FD')
      .borderRadius(10)
      .padding(15)

      Column({ space: 10 }) {
        Text('实验类型')
          .fontSize(18)
          .fontWeight(FontWeight.Bold)
          .width('100%')
          .textAlign(TextAlign.Center)

        Row({ space: 10 }) {
          Button('抛硬币')
            .width('48%')
            .height(40)
            .fontSize(14)
            .backgroundColor(this.experimentType.type === 'coin' ? '#2196F3' : '#E0E0E0')
            .onClick(() => {
              this.switchExperiment('coin')
            })

          Button('摸球实验')
            .width('48%')
            .height(40)
            .fontSize(14)
            .backgroundColor(this.experimentType.type === 'ball' ? '#2196F3' : '#E0E0E0')
            .onClick(() => {
              this.switchExperiment('ball')
            })
        }
        .width('100%')
        .justifyContent(FlexAlign.SpaceBetween)
      }
      .width('90%')
      .padding(10)
      .backgroundColor('#FAFAFA')
      .borderRadius(10)

      Column({ space: 10 }) {
        Text('实验说明')
          .fontSize(18)
          .fontWeight(FontWeight.Bold)
          .width('100%')
          .textAlign(TextAlign.Center)

        Text(this.experimentType.description)
          .fontSize(14)
          .fontColor('#666666')
          .textAlign(TextAlign.Center)
      }
      .width('100%')
      .padding(10)
      .backgroundColor('#FFF3E0')
      .borderRadius(10)

      Column({ space: 10 }) {
        Text('实验控制')
          .fontSize(18)
          .fontWeight(FontWeight.Bold)
          .width('100%')
          .textAlign(TextAlign.Center)

        Column({ space: 8 }) {
          Text(`每次实验次数: ${this.batchSize}`)
            .fontSize(14)
            .fontColor('#666666')

          Slider({
            value: this.batchSize,
            min: 1,
            max: 100,
            step: 1
          })
            .width('100%')
            .blockColor('#2196F3')
            .trackColor('#E0E0E0')
            .selectedColor('#2196F3')
            .onChange((value: number) => {
              this.batchSize = value
            })
        }
        .width('100%')
        .padding(8)
        .backgroundColor('#F5F5F5')
        .borderRadius(6)

        Row({ space: 10 }) {
          Button('开始实验')
            .width('48%')
            .height(50)
            .fontSize(16)
            .backgroundColor('#4CAF50')
            .onClick(() => {
              this.startExperiment()
            })

          Button('重置')
            .width('48%')
            .height(50)
            .fontSize(16)
            .backgroundColor('#FF9800')
            .onClick(() => {
              this.reset()
            })
        }
        .width('100%')
        .justifyContent(FlexAlign.SpaceBetween)
      }
      .width('90%')
      .padding(10)
      .backgroundColor('#FAFAFA')
      .borderRadius(10)

      Column({ space: 10 }) {
        Text('实验结果')
          .fontSize(18)
          .fontWeight(FontWeight.Bold)
          .width('100%')
          .textAlign(TextAlign.Center)

        if (this.experimentType.type === 'coin') {
          Column({ space: 8 }) {
            Row({ space: 10 }) {
              Column({ space: 5 }) {
                Text('正面')
                  .fontSize(14)
                  .fontColor('#666666')
                Text(`${this.experimentResult.heads}`)
                  .fontSize(24)
                  .fontColor('#2196F3')
                  .fontWeight(FontWeight.Bold)
                Text(`频率: ${this.getHeadsFrequency().toFixed(4)}`)
                  .fontSize(12)
                  .fontColor('#666666')
              }
              .width('48%')
              .padding(10)
              .backgroundColor('#E3F2FD')
              .borderRadius(8)

              Column({ space: 5 }) {
                Text('反面')
                  .fontSize(14)
                  .fontColor('#666666')
                Text(`${this.experimentResult.tails}`)
                  .fontSize(24)
                  .fontColor('#FF9800')
                  .fontWeight(FontWeight.Bold)
                Text(`频率: ${this.getTailsFrequency().toFixed(4)}`)
                  .fontSize(12)
                  .fontColor('#666666')
              }
              .width('48%')
              .padding(10)
              .backgroundColor('#FFF3E0')
              .borderRadius(8)
            }
            .width('100%')
            .justifyContent(FlexAlign.SpaceBetween)

            Text(`总实验次数: ${this.experimentResult.total}`)
              .fontSize(16)
              .fontColor('#9C27B0')
              .fontWeight(FontWeight.Bold)
              .width('100%')
              .textAlign(TextAlign.Center)
          }
          .width('100%')
          .padding(15)
          .backgroundColor('#FFFFFF')
          .borderRadius(10)
        } else {
          Column({ space: 8 }) {
            Row({ space: 10 }) {
              Column({ space: 5 }) {
                Text('红球')
                  .fontSize(14)
                  .fontColor('#666666')
                Text(`${this.experimentResult.red}`)
                  .fontSize(24)
                  .fontColor('#F44336')
                  .fontWeight(FontWeight.Bold)
                Text(`频率: ${this.getRedFrequency().toFixed(4)}`)
                  .fontSize(12)
                  .fontColor('#666666')
              }
              .width('31%')
              .padding(10)
              .backgroundColor('#FFEBEE')
              .borderRadius(8)

              Column({ space: 5 }) {
                Text('蓝球')
                  .fontSize(14)
                  .fontColor('#666666')
                Text(`${this.experimentResult.blue}`)
                  .fontSize(24)
                  .fontColor('#2196F3')
                  .fontWeight(FontWeight.Bold)
                Text(`频率: ${this.getBlueFrequency().toFixed(4)}`)
                  .fontSize(12)
                  .fontColor('#666666')
              }
              .width('31%')
              .padding(10)
              .backgroundColor('#E3F2FD')
              .borderRadius(8)

              Column({ space: 5 }) {
                Text('绿球')
                  .fontSize(14)
                  .fontColor('#666666')
                Text(`${this.experimentResult.green}`)
                  .fontSize(24)
                  .fontColor('#4CAF50')
                  .fontWeight(FontWeight.Bold)
                Text(`频率: ${this.getGreenFrequency().toFixed(4)}`)
                  .fontSize(12)
                  .fontColor('#666666')
              }
              .width('31%')
              .padding(10)
              .backgroundColor('#E8F5E9')
              .borderRadius(8)
            }
            .width('100%')
            .justifyContent(FlexAlign.SpaceBetween)

            Text(`总实验次数: ${this.experimentResult.total}`)
              .fontSize(16)
              .fontColor('#9C27B0')
              .fontWeight(FontWeight.Bold)
              .width('100%')
              .textAlign(TextAlign.Center)
          }
          .width('100%')
          .padding(15)
          .backgroundColor('#FFFFFF')
          .borderRadius(10)
        }
      }
      .width('100%')
      .padding(10)
      .backgroundColor('#FAFAFA')
      .borderRadius(10)

      Column({ space: 10 }) {
        Text('频率变化曲线')
          .fontSize(18)
          .fontWeight(FontWeight.Bold)
          .width('100%')
          .textAlign(TextAlign.Center)

        Canvas(this.canvasContext)
          .width(this.canvasWidth)
          .height(this.canvasHeight)
          .backgroundColor('#FFFFFF')
          .border({ width: 2, color: '#333' })
          .borderRadius(10)
          .onReady(() => {
            this.drawFrequencyChart()
          })
      }
      .width('100%')
      .padding(10)
      .backgroundColor('#FAFAFA')
      .borderRadius(10)

      Column({ space: 8 }) {
        Text('使用说明')
          .fontSize(16)
          .fontWeight(FontWeight.Bold)

        Text('• 选择实验类型(抛硬币或摸球)')
          .fontSize(14)
          .fontColor('#666666')

        Text('• 设置每次实验的次数')
          .fontSize(14)
          .fontColor('#666666')

        Text('• 点击"开始实验"进行模拟')
          .fontSize(14)
          .fontColor('#666666')

        Text('• 观察频率趋于稳定的过程')
          .fontSize(14)
          .fontColor('#666666')

        Text('• 理解概率的统计定义')
          .fontSize(14)
          .fontColor('#666666')

        Text('• 验证大数定律')
          .fontSize(14)
          .fontColor('#666666')
      }
      .width('95%')
      .padding(12)
      .backgroundColor('#FFF3E0')
      .borderRadius(10)
    }
    .width('100%')
    .height('100%')
    .padding(10)
    .justifyContent(FlexAlign.Start)
  }

  private canvasContext: CanvasRenderingContext2D = new CanvasRenderingContext2D();

  private switchExperiment(type: 'coin' | 'ball') {
    if (type === 'coin') {
      this.experimentType = {
        type: 'coin',
        name: '抛硬币实验',
        description: '模拟抛硬币,观察正面和反面出现的频率'
      }
    } else {
      this.experimentType = {
        type: 'ball',
        name: '摸球实验',
        description: '模拟从装有红、蓝、绿球的袋子中摸球,观察各颜色出现的频率'
      }
    }
    this.reset()
  }

  private startExperiment() {
    this.isRunning = true

    for (let i = 0; i < this.batchSize; i++) {
      if (this.experimentType.type === 'coin') {
        this.flipCoin()
      } else {
        this.drawBall()
      }
    }

    this.recordFrequency()
    this.drawFrequencyChart()
    this.isRunning = false
  }

  private flipCoin() {
    const result = Math.random() < 0.5 ? 'heads' : 'tails'
    if (result === 'heads') {
      this.experimentResult.heads++
    } else {
      this.experimentResult.tails++
    }
    this.experimentResult.total++
  }

  private drawBall() {
    const result = Math.random()
    if (result < 0.33) {
      this.experimentResult.red++
    } else if (result < 0.66) {
      this.experimentResult.blue++
    } else {
      this.experimentResult.green++
    }
    this.experimentResult.total++
  }

  private recordFrequency() {
    const record: FrequencyRecord = {
      heads: this.getHeadsFrequency(),
      tails: this.getTailsFrequency(),
      red: this.getRedFrequency(),
      blue: this.getBlueFrequency(),
      green: this.getGreenFrequency()
    }
    this.frequencyHistory.push(record)

    if (this.frequencyHistory.length > 100) {
      this.frequencyHistory.shift()
    }
  }

  private getHeadsFrequency(): number {
    return this.experimentResult.total > 0 ? this.experimentResult.heads / this.experimentResult.total : 0
  }

  private getTailsFrequency(): number {
    return this.experimentResult.total > 0 ? this.experimentResult.tails / this.experimentResult.total : 0
  }

  private getRedFrequency(): number {
    return this.experimentResult.total > 0 ? this.experimentResult.red / this.experimentResult.total : 0
  }

  private getBlueFrequency(): number {
    return this.experimentResult.total > 0 ? this.experimentResult.blue / this.experimentResult.total : 0
  }

  private getGreenFrequency(): number {
    return this.experimentResult.total > 0 ? this.experimentResult.green / this.experimentResult.total : 0
  }

  private reset() {
    this.experimentResult = {
      heads: 0,
      tails: 0,
      red: 0,
      blue: 0,
      green: 0,
      total: 0
    }
    this.frequencyHistory = []
    this.drawFrequencyChart()
  }

  private drawFrequencyChart() {
    const ctx = this.canvasContext
    ctx.clearRect(0, 0, this.canvasWidth, this.canvasHeight)

    if (this.frequencyHistory.length === 0) {
      ctx.fillStyle = '#999999'
      ctx.font = '16px sans-serif'
      ctx.fillText('请先开始实验', this.canvasWidth / 2 - 60, this.canvasHeight / 2)
      return
    }

    const padding = 50
    const chartWidth = this.canvasWidth - 2 * padding
    const chartHeight = this.canvasHeight - 2 * padding

    this.drawAxes(ctx, padding, chartWidth, chartHeight)

    if (this.experimentType.type === 'coin') {
      this.drawCoinFrequencyLines(ctx, padding, chartWidth, chartHeight)
    } else {
      this.drawBallFrequencyLines(ctx, padding, chartWidth, chartHeight)
    }
  }

  private drawCoinFrequencyLines(ctx: CanvasRenderingContext2D, padding: number, chartWidth: number, chartHeight: number) {
    ctx.lineWidth = 2

    ctx.strokeStyle = '#2196F3'
    ctx.beginPath()
    this.frequencyHistory.forEach((record: FrequencyRecord, index: number) => {
      const x = padding + (index / (this.frequencyHistory.length - 1 || 1)) * chartWidth
      const y = padding + chartHeight - record.heads * chartHeight
      if (index === 0) {
        ctx.moveTo(x, y)
      } else {
        ctx.lineTo(x, y)
      }
    })
    ctx.stroke()

    ctx.strokeStyle = '#FF9800'
    ctx.beginPath()
    this.frequencyHistory.forEach((record: FrequencyRecord, index: number) => {
      const x = padding + (index / (this.frequencyHistory.length - 1 || 1)) * chartWidth
      const y = padding + chartHeight - record.tails * chartHeight
      if (index === 0) {
        ctx.moveTo(x, y)
      } else {
        ctx.lineTo(x, y)
      }
    })
    ctx.stroke()

    ctx.fillStyle = '#2196F3'
    ctx.font = '12px sans-serif'
    ctx.fillText('正面频率', 10, 20)

    ctx.fillStyle = '#FF9800'
    ctx.fillText('反面频率', 10, 40)
  }

  private drawBallFrequencyLines(ctx: CanvasRenderingContext2D, padding: number, chartWidth: number, chartHeight: number) {
    ctx.lineWidth = 2

    ctx.strokeStyle = '#F44336'
    ctx.beginPath()
    this.frequencyHistory.forEach((record: FrequencyRecord, index: number) => {
      const x = padding + (index / (this.frequencyHistory.length - 1 || 1)) * chartWidth
      const y = padding + chartHeight - record.red * chartHeight
      if (index === 0) {
        ctx.moveTo(x, y)
      } else {
        ctx.lineTo(x, y)
      }
    })
    ctx.stroke()

    ctx.strokeStyle = '#2196F3'
    ctx.beginPath()
    this.frequencyHistory.forEach((record: FrequencyRecord, index: number) => {
      const x = padding + (index / (this.frequencyHistory.length - 1 || 1)) * chartWidth
      const y = padding + chartHeight - record.blue * chartHeight
      if (index === 0) {
        ctx.moveTo(x, y)
      } else {
        ctx.lineTo(x, y)
      }
    })
    ctx.stroke()

    ctx.strokeStyle = '#4CAF50'
    ctx.beginPath()
    this.frequencyHistory.forEach((record: FrequencyRecord, index: number) => {
      const x = padding + (index / (this.frequencyHistory.length - 1 || 1)) * chartWidth
      const y = padding + chartHeight - record.green * chartHeight
      if (index === 0) {
        ctx.moveTo(x, y)
      } else {
        ctx.lineTo(x, y)
      }
    })
    ctx.stroke()

    ctx.fillStyle = '#F44336'
    ctx.font = '12px sans-serif'
    ctx.fillText('红球频率', 10, 20)

    ctx.fillStyle = '#2196F3'
    ctx.fillText('蓝球频率', 10, 40)

    ctx.fillStyle = '#4CAF50'
    ctx.fillText('绿球频率', 10, 60)
  }

  private drawAxes(ctx: CanvasRenderingContext2D, padding: number, chartWidth: number, chartHeight: number) {
    ctx.strokeStyle = '#333'
    ctx.lineWidth = 2

    ctx.beginPath()
    ctx.moveTo(padding, padding)
    ctx.lineTo(padding, padding + chartHeight)
    ctx.lineTo(padding + chartWidth, padding + chartHeight)
    ctx.stroke()

    ctx.fillStyle = '#333'
    ctx.font = '12px sans-serif'
    ctx.fillText('频率', padding - 20, padding - 10)
    ctx.fillText('实验次数', padding + chartWidth - 40, padding + chartHeight + 20)

    for (let i = 0; i <= 10; i++) {
      const y = padding + (chartHeight / 10) * i
      ctx.fillText((1 - i * 0.1).toFixed(1), padding - 25, y + 4)
    }
  }
}

讨论HarmonyOS开发技术,专注于API与组件、DevEco Studio、测试、元服务和应用上架分发等。
更多推荐
 0
0 0
0- 0


 已为社区贡献401条内容

所有评论(0)