《HarmonyOS技术精讲-ArkGraphics 2D(方舟2D图形服务)》第九篇:数据可视化——柱状图与饼图的绘制实战
HarmonyOS 技术精讲 — ArkGraphics 2D(方舟2D图形服务)第九篇:数据可视化——柱状图与饼图的绘制实战
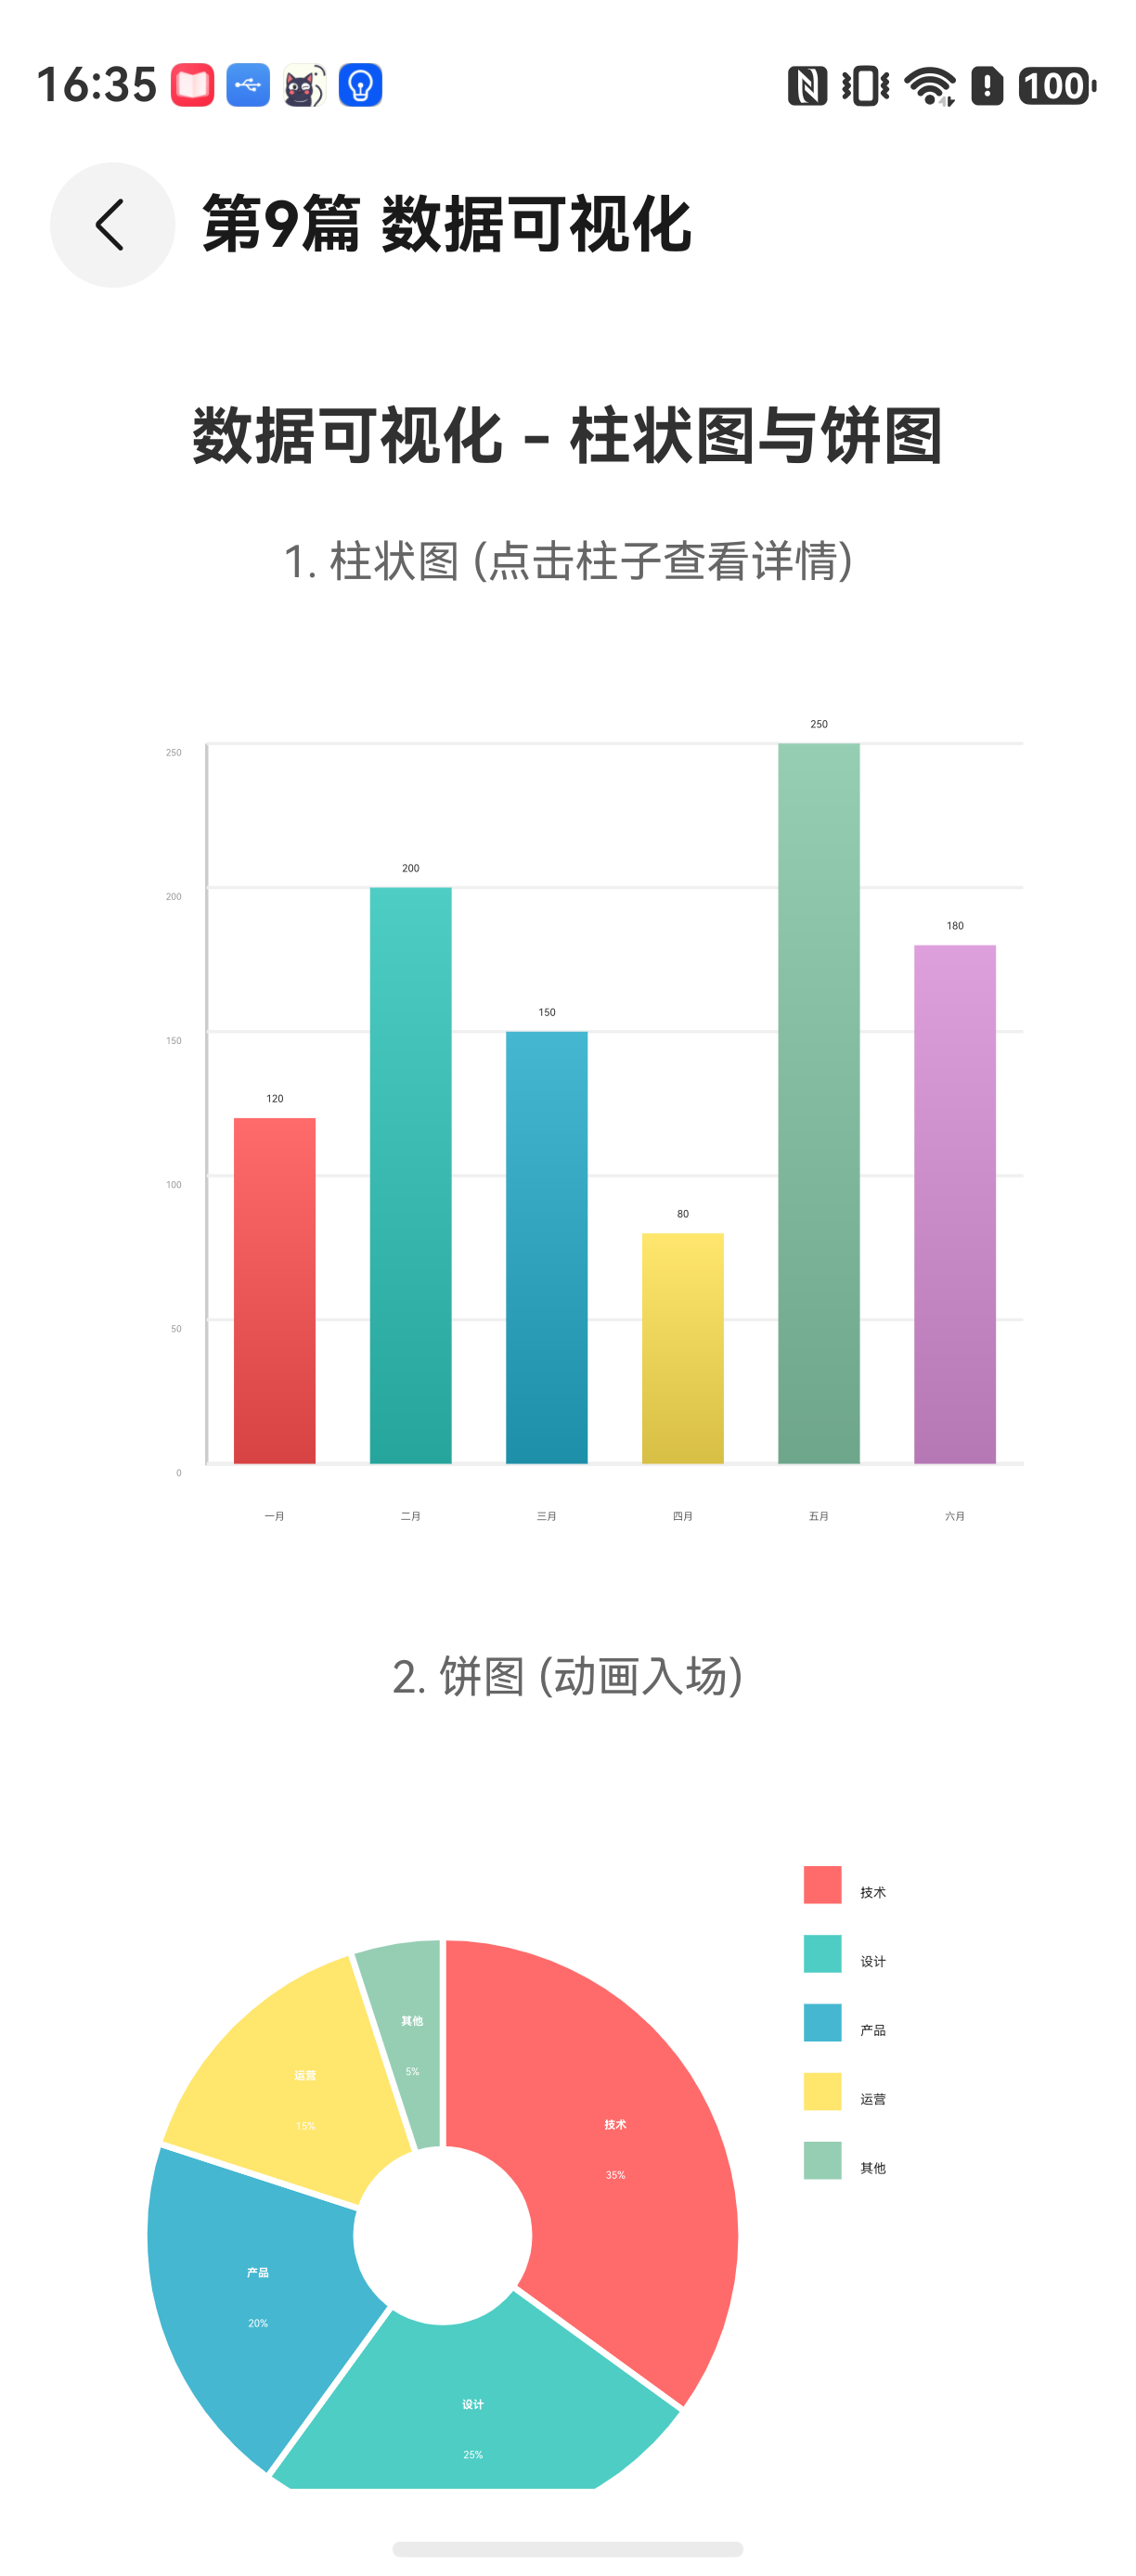
HarmonyOS NEXT 应用里,数据可视化并不只是把数据画出来那么简单。柱状图和饼图看起来是基础图表,但真正要实现可交互、带入场动画、支持数据动态更新、且触摸反馈准确的组件,实际的 Canvas 绘制逻辑比大多数开发者想象的要复杂。
官方文档对 Canvas 的 API 说明比较完整,但具体到图表这种复合场景——坐标轴计算、扇形路径闭合、动画进度与渲染同步、触摸命中检测——文档并不会告诉你这些细节怎么组合。这篇就围绕两个完整的组件实现,把这些问题逐一讲清楚。
环境说明
DevEco Studio 版本:DevEco Studio 6.1.0 及以上
HarmonyOS SDK 版本:HarmonyOS 6.1.0(23) 及以上
目标设备:手机
组件设计思路
两个图表组件共用一套数据模型,方便统一管理。每个组件独立封装,通过 @Prop 接收数据,通过 @State 管理动画进度和交互状态。
数据模型定义:
// ChartData.ets
export interface ChartItem {
  label: string;
  value: number;
  color?: ResourceStr;
}

export interface ChartData {
  items: ChartItem[];
  title?: string;
}
这种设计的好处是:柱状图和饼图可以接收同一份数据,只是渲染方式不同。后续如果增加折线图或雷达图,数据模型不需要改。
柱状图完整实现
柱状图的核心难点在于坐标轴刻度计算、柱子宽度自适应、以及触摸命中检测。动画方面需要实现柱子从底部逐渐升高的入场效果。
// BarChart.ets
import { ChartItem } from './ChartData';

@Component
export struct BarChart {
  @Prop data: ChartItem[] = [];
  private canvasCtx: CanvasRenderingContext2D = new CanvasRenderingContext2D();
  @State private animProgress: number = 0; // 0~1 动画进度
  @State private selectedIndex: number = -1;
  @State private tooltipVisible: boolean = false;
  @State private tooltipInfo: string = '';
  @State private tooltipX: number = 0;
  @State private tooltipY: number = 0;

  private paddingLeft: number = 50;
  private paddingRight: number = 20;
  private paddingTop: number = 40;
  private paddingBottom: number = 50;
  private barGapRatio: number = 0.3; // 柱子间距比例

  private animDuration: number = 800; // 动画持续时间(ms)
  private startTime: number = 0;

  aboutToAppear(): void {
    this.startAnimation();
  }

  startAnimation(): void {
    this.animProgress = 0;
    this.startTime = Date.now();
    const step = () => {
      const elapsed = Date.now() - this.startTime;
      const progress = Math.min(elapsed / this.animDuration, 1);
      this.animProgress = progress;
      if (progress < 1) {
        requestAnimationFrame(step);
      }
    };
    requestAnimationFrame(step);
  }

  drawChart(): void {
    const ctx = this.canvasCtx;
    const width = ctx.width;
    const height = ctx.height;
    ctx.clearRect(0, 0, width, height);

    if (this.data.length === 0) return;

    const chartWidth = width - this.paddingLeft - this.paddingRight;
    const chartHeight = height - this.paddingTop - this.paddingBottom;

    // 计算最大值
    const maxValue = Math.max(...this.data.map(item => item.value));

    // 绘制Y轴和刻度
    this.drawYAxis(ctx, maxValue, chartHeight);

    // 绘制X轴和标签
    this.drawXAxis(ctx, chartHeight);

    // 绘制柱子(带动画)
    const totalBarWidth = chartWidth / this.data.length;
    const barWidth = totalBarWidth * (1 - this.barGapRatio);
    const gap = totalBarWidth * this.barGapRatio / 2;

    this.data.forEach((item, index) => {
      const x = this.paddingLeft + index * totalBarWidth + gap;
      const targetHeight = (item.value / maxValue) * chartHeight;
      const currentHeight = targetHeight * this.animProgress;
      const y = this.paddingTop + chartHeight - currentHeight;

      // 判断是否高亮
      const isSelected = (this.selectedIndex === index);

      // 绘制柱子渐变
      const gradient = ctx.createLinearGradient(x, y, x, this.paddingTop + chartHeight);
      const baseColor = item.color || '#007AFF';
      gradient.addColorStop(0, baseColor);
      gradient.addColorStop(1, this.adjustBrightness(baseColor, -30));

      ctx.beginPath();
      ctx.rect(x, y, barWidth, currentHeight);
      ctx.fillStyle = isSelected ? '#FF9500' : gradient;
      ctx.fill();

      if (isSelected) {
        ctx.strokeStyle = '#FF3B30';
        ctx.lineWidth = 2;
        ctx.stroke();
      }

      // 在柱子顶部显示数值
      if (currentHeight > 20) {
        ctx.fillStyle = '#333333';
        ctx.font = '12px sans-serif';
        ctx.textAlign = 'center';
        ctx.fillText(item.value.toString(), x + barWidth / 2, y - 6);
      }
    });

    // 绘制Tooltip
    if (this.tooltipVisible && this.selectedIndex >= 0) {
      this.drawTooltip(ctx, this.data[this.selectedIndex]);
    }

    // 绘制图例
    this.drawLegend(ctx);
  }

  private drawYAxis(ctx: CanvasRenderingContext2D, maxValue: number, chartHeight: number): void {
    const yAxisX = this.paddingLeft;
    const yAxisStartY = this.paddingTop;
    const yAxisEndY = this.paddingTop + chartHeight;

    // Y轴线
    ctx.beginPath();
    ctx.moveTo(yAxisX, yAxisStartY);
    ctx.lineTo(yAxisX, yAxisEndY);
    ctx.strokeStyle = '#CCCCCC';
    ctx.lineWidth = 1;
    ctx.stroke();

    // 刻度和网格线
    const tickCount = 5;
    ctx.textAlign = 'right';
    ctx.font = '11px sans-serif';
    ctx.fillStyle = '#999999';

    for (let i = 0; i <= tickCount; i++) {
      const value = (maxValue / tickCount) * i;
      const y = yAxisEndY - (value / maxValue) * chartHeight;

      // 刻度线
      ctx.beginPath();
      ctx.moveTo(yAxisX - 4, y);
      ctx.lineTo(yAxisX, y);
      ctx.strokeStyle = '#CCCCCC';
      ctx.stroke();

      // 网格线
      ctx.beginPath();
      ctx.moveTo(yAxisX, y);
      ctx.lineTo(yAxisX + ctx.width - this.paddingLeft - this.paddingRight, y);
      ctx.strokeStyle = '#F0F0F0';
      ctx.stroke();

      // 标签
      ctx.fillText(Math.round(value).toString(), yAxisX - 8, y + 4);
    }
  }

  private drawXAxis(ctx: CanvasRenderingContext2D, chartHeight: number): void {
    const xAxisY = this.paddingTop + chartHeight;
    const chartWidth = ctx.width - this.paddingLeft - this.paddingRight;

    // X轴线
    ctx.beginPath();
    ctx.moveTo(this.paddingLeft, xAxisY);
    ctx.lineTo(this.paddingLeft + chartWidth, xAxisY);
    ctx.strokeStyle = '#CCCCCC';
    ctx.lineWidth = 1;
    ctx.stroke();

    // X轴标签
    ctx.textAlign = 'center';
    ctx.font = '12px sans-serif';
    ctx.fillStyle = '#666666';

    const totalBarWidth = chartWidth / this.data.length;
    this.data.forEach((item, index) => {
      const x = this.paddingLeft + index * totalBarWidth + totalBarWidth / 2;
      ctx.fillText(item.label, x, xAxisY + 20);
    });
  }

  private drawLegend(ctx: CanvasRenderingContext2D): void {
    const width = ctx.width;
    const y = 18;
    let x = width - 100;

    ctx.font = '12px sans-serif';
    ctx.fillStyle = '#333333';
    ctx.textAlign = 'left';

    this.data.forEach((item, index) => {
      const color = item.color || '#007AFF';
      // 色块
      ctx.fillStyle = color;
      ctx.beginPath();
      ctx.rect(x, y - 8, 12, 12);
      ctx.fill();

      // 标签
      ctx.fillStyle = '#333333';
      ctx.fillText(item.label, x + 18, y + 2);
      x += 60;
    });
  }

  private drawTooltip(ctx: CanvasRenderingContext2D, item: ChartItem): void {
    const padding = 8;
    const text = `${item.label}: ${item.value}`;
    ctx.font = '13px sans-serif';
    const textWidth = ctx.measureText(text).width;
    const boxWidth = textWidth + padding * 2;
    const boxHeight = 30;

    let tx = this.tooltipX;
    let ty = this.tooltipY - 40;

    // 边界限制,防止 tooltip 超出画布边缘
    if (tx + boxWidth > ctx.width) {
      tx = ctx.width - boxWidth - 5;
    }
    if (ty < 0) {
      ty = this.tooltipY + 20;
    }

    // 背景
    ctx.fillStyle = 'rgba(0, 0, 0, 0.8)';
    ctx.beginPath();
    this.roundRect(ctx, tx, ty, boxWidth, boxHeight, 6);
    ctx.fill();

    // 文本
    ctx.fillStyle = '#FFFFFF';
    ctx.textAlign = 'left';
    ctx.fillText(text, tx + padding, ty + 20);
  }

  private roundRect(ctx: CanvasRenderingContext2D, x: number, y: number, w: number, h: number, r: number): void {
    ctx.moveTo(x + r, y);
    ctx.lineTo(x + w - r, y);
    ctx.arcTo(x + w, y, x + w, y + h, r);
    ctx.lineTo(x + w, y + h - r);
    ctx.arcTo(x + w, y + h, x + w - r, y + h, r);
    ctx.lineTo(x + r, y + h);
    ctx.arcTo(x, y + h, x, y + h - r, r);
    ctx.lineTo(x, y + r);
    ctx.arcTo(x, y, x + r, y, r);
    ctx.closePath();
  }

  private adjustBrightness(hexColor: string, percent: number): string {
    // 简单的颜色亮度调整,用于生成渐变端点色
    let r: number = 0;
    let g: number = 0;
    let b: number = 0;
    if (hexColor.startsWith('#')) {
      const hex = hexColor.slice(1);
      if (hex.length === 6) {
        r = parseInt(hex.substring(0, 2), 16);
        g = parseInt(hex.substring(2, 4), 16);
        b = parseInt(hex.substring(4, 6), 16);
      }
    }
    r = Math.max(0, Math.min(255, r + percent));
    g = Math.max(0, Math.min(255, g + percent));
    b = Math.max(0, Math.min(255, b + percent));
    return `rgb(${r}, ${g}, ${b})`;
  }

  // 触摸命中检测:判断触摸点是否落在某个柱子的区域内
  private hitTest(x: number, y: number): number {
    const width = this.canvasCtx.width;
    const height = this.canvasCtx.height;
    const chartWidth = width - this.paddingLeft - this.paddingRight;
    const chartHeight = height - this.paddingTop - this.paddingBottom;
    const maxValue = Math.max(...this.data.map(item => item.value));
    const totalBarWidth = chartWidth / this.data.length;
    const barWidth = totalBarWidth * (1 - this.barGapRatio);
    const gap = totalBarWidth * this.barGapRatio / 2;

    for (let i = this.data.length - 1; i >= 0; i--) {
      const barX = this.paddingLeft + i * totalBarWidth + gap;
      const targetHeight = (this.data[i].value / maxValue) * chartHeight;
      const currentHeight = targetHeight * this.animProgress;
      const barY = this.paddingTop + chartHeight - currentHeight;

      if (x >= barX && x <= barX + barWidth && y >= barY && y <= this.paddingTop + chartHeight) {
        return i;
      }
    }
    return -1;
  }

  // 触摸事件处理
  onTouch(event: TouchEvent): void {
    const touch = event.touches[0];
    if (!touch) return;

    const rect = touch.target!.getBoundingClientRect();
    if (!rect) return;
    const x = touch.x - rect.left;
    const y = touch.y - rect.top;

    if (event.type === TouchType.Down) {
      const hitIndex = this.hitTest(x, y);
      if (hitIndex >= 0) {
        this.selectedIndex = hitIndex;
        this.tooltipVisible = true;
        this.tooltipX = x;
        this.tooltipY = y;
      } else {
        this.selectedIndex = -1;
        this.tooltipVisible = false;
      }
    } else if (event.type === TouchType.Move) {
      if (this.tooltipVisible) {
        this.tooltipX = x;
        this.tooltipY = y;
      }
    } else if (event.type === TouchType.Up) {
      // 点击后停留片刻再收起 tooltip,这里由应用层控制
    }
  }

  build() {
    Column() {
      Canvas(this.canvasCtx)
        .width('100%')
        .height(300)
        .onReady(() => {
          this.drawChart();
        })
        .onTouch((event: TouchEvent) => {
          this.onTouch(event);
        })
    }
    .onClick(() => {
      // 点击空白区域取消选中
      this.selectedIndex = -1;
      this.tooltipVisible = false;
    })
    .clip(true)
  }
}
柱状图关键点说明
动画与渲染同步: requestAnimationFrame 的回调里更新 @State 变量 animProgress,ArkUI 会自动触发 build() 和 Canvas 的重绘。注意这里没有直接用 Canvas 的 requestAnimationFrame 逐帧绘制,而是利用状态驱动——好处是动画进度丢失后能自动恢复,坏处是每帧都会走完整的组件更新流程。如果数据量大(超过 50 个柱子),建议改为 Canvas 内部逐帧绘制,跳过状态管理开销。
触摸命中检测: hitTest 方法遍历所有柱子,检查触摸点是否在柱子的矩形区域内。这里有个细节:触摸坐标需要从 TouchEvent 的 x/y 减去 getBoundingClientRect() 的偏移,因为 Canvas 的坐标原点在画布左上角,而 TouchEvent 的坐标是相对于屏幕的。
饼图完整实现
饼图的技术难点和柱状图完全不同。扇形绘制涉及 arc 路径的精确闭合,而且当角度接近 360° 时,arc 的起始点和终止点几乎重合,closePath 的行为需要额外处理。入场动画方面,饼图通常有两种实现方式:扇形从 0° 展开(展开动画),或者从中心向外缩放(缩放动画)。这里采用展开动画,每个扇形从起始角度开始逐步延伸到终止角度。
// PieChart.ets
import { ChartItem } from './ChartData';

@Component
export struct PieChart {
  @Prop data: ChartItem[] = [];
  private canvasCtx: CanvasRenderingContext2D = new CanvasRenderingContext2D();
  @State private animProgress: number = 0; // 0~1 动画进度
  @State private selectedIndex: number = -1;
  @State private tooltipVisible: boolean = false;
  @State private tooltipX: number = 0;
  @State private tooltipY: number = 0;

  private padding: number = 40;
  private animDuration: number = 1000; // 动画持续时间(ms)
  private startTime: number = 0;

  aboutToAppear(): void {
    this.startAnimation();
  }

  startAnimation(): void {
    this.animProgress = 0;
    this.startTime = Date.now();
    const step = () => {
      const elapsed = Date.now() - this.startTime;
      const progress = Math.min(elapsed / this.animDuration, 1);
      this.animProgress = progress;
      if (progress < 1) {
        requestAnimationFrame(step);
      }
    };
    requestAnimationFrame(step);
  }

  drawChart(): void {
    const ctx = this.canvasCtx;
    const width = ctx.width;
    const height = ctx.height;
    ctx.clearRect(0, 0, width, height);

    if (this.data.length === 0) return;

    // 计算总数
    const total = this.data.reduce((sum, item) => sum + item.value, 0);
    if (total <= 0) return;

    // 饼图半径(取宽高较小值的一半,再减去边距)
    const radius = Math.min(width, height) / 2 - this.padding;
    const centerX = width / 2;
    const centerY = height / 2;

    // 计算每个扇形的角度
    const angles: number[] = [];
    this.data.forEach((item) => {
      angles.push((item.value / total) * Math.PI * 2);
    });

    // 绘制扇形(带动画)
    let currentAngle = -Math.PI / 2; // 从12点钟方向开始
    // 先计算到当前动画进度为止的总展开角度
    const totalAngle = Math.PI * 2 * this.animProgress;
    let drawnAngle = 0;

    this.data.forEach((item, index) => {
      const sliceAngle = angles[index];
      const isSelected = (this.selectedIndex === index);
      const color = item.color || this.getDefaultColor(index);

      // 根据动画进度决定这个扇形画多少
      const remaining = totalAngle - drawnAngle;
      const drawAngle = Math.min(sliceAngle, Math.max(0, remaining));

      if (drawAngle <= 0) {
        drawnAngle += sliceAngle;
        return;
      }

      const endAngle = currentAngle + drawAngle;

      ctx.beginPath();
      ctx.moveTo(centerX, centerY);
      ctx.arc(centerX, centerY, radius, currentAngle, endAngle);
      ctx.closePath();

      // 选中时外扩一点 (explode 效果)
      if (isSelected) {
        const midAngle = currentAngle + drawAngle / 2;
        const offsetX = Math.cos(midAngle) * 8;
        const offsetY = Math.sin(midAngle) * 8;
        ctx.save();
        ctx.translate(offsetX, offsetY);
        ctx.beginPath();
        ctx.moveTo(centerX + offsetX, centerY + offsetY);
        ctx.arc(centerX + offsetX, centerY + offsetY, radius, currentAngle, endAngle);
        ctx.closePath();
        ctx.fillStyle = color;
        ctx.fill();
        ctx.restore();
      } else {
        ctx.fillStyle = color;
        ctx.fill();

        // 描边分割线
        ctx.strokeStyle = '#FFFFFF';
        ctx.lineWidth = 2;
        ctx.stroke();
      }

      // 绘制标签(文字方向指向扇形中部)
      const midAngle = currentAngle + drawAngle / 2;
      const labelRadius = radius * 0.65;
      const labelX = centerX + Math.cos(midAngle) * labelRadius;
      const labelY = centerY + Math.sin(midAngle) * labelRadius;

      if (drawAngle > 0.3) { // 扇形足够大才显示文字,避免文字重叠
        ctx.fillStyle = '#FFFFFF';
        ctx.font = '12px sans-serif';
        ctx.textAlign = 'center';
        ctx.textBaseline = 'middle';
        ctx.fillText(
          Math.round((item.value / total) * 100) + '%',
          labelX, labelY
        );
      }

      currentAngle += sliceAngle;
      drawnAngle += sliceAngle;
    });

    // 绘制图例
    this.drawLegend(ctx);

    // 绘制 Tooltip
    if (this.tooltipVisible && this.selectedIndex >= 0) {
      this.drawTooltip(ctx, this.data[this.selectedIndex]);
    }
  }

  private getDefaultColor(index: number): string {
    const colors: string[] = [
      '#007AFF', '#FF9500', '#34C759', '#FF3B30',
      '#AF52DE', '#5856D6', '#00C7BE', '#FF2D55'
    ];
    return colors[index % colors.length];
  }

  private drawLegend(ctx: CanvasRenderingContext2D): void {
    const width = ctx.width;
    const y = 18;
    let x = width - 100;

    ctx.font = '12px sans-serif';
    ctx.fillStyle = '#333333';
    ctx.textAlign = 'left';

    this.data.forEach((item, index) => {
      const color = item.color || this.getDefaultColor(index);
      // 色块
      ctx.fillStyle = color;
      ctx.beginPath();
      ctx.rect(x, y - 8, 12, 12);
      ctx.fill();

      // 标签
      ctx.fillStyle = '#333333';
      ctx.fillText(item.label, x + 18, y + 2);
      x += 60;
    });
  }

  private drawTooltip(ctx: CanvasRenderingContext2D, item: ChartItem): void {
    const total = this.data.reduce((sum, cur) => sum + cur.value, 0);
    const percent = ((item.value / total) * 100).toFixed(1);
    const text = `${item.label}: ${item.value} (${percent}%)`;
    const padding = 8;

    ctx.font = '13px sans-serif';
    const textWidth = ctx.measureText(text).width;
    const boxWidth = textWidth + padding * 2;
    const boxHeight = 30;

    let tx = this.tooltipX;
    let ty = this.tooltipY - 40;

    // 边界限制
    if (tx + boxWidth > ctx.width) {
      tx = ctx.width - boxWidth - 5;
    }
    if (ty < 0) {
      ty = this.tooltipY + 20;
    }

    ctx.fillStyle = 'rgba(0, 0, 0, 0.8)';
    ctx.beginPath();
    this.roundRect(ctx, tx, ty, boxWidth, boxHeight, 6);
    ctx.fill();

    ctx.fillStyle = '#FFFFFF';
    ctx.textAlign = 'left';
    ctx.fillText(text, tx + padding, ty + 20);
  }

  private roundRect(ctx: CanvasRenderingContext2D, x: number, y: number, w: number, h: number, r: number): void {
    ctx.moveTo(x + r, y);
    ctx.lineTo(x + w - r, y);
    ctx.arcTo(x + w, y, x + w, y + h, r);
    ctx.lineTo(x + w, y + h - r);
    ctx.arcTo(x + w, y + h, x + w - r, y + h, r);
    ctx.lineTo(x + r, y + h);
    ctx.arcTo(x, y + h, x, y + h - r, r);
    ctx.lineTo(x, y + r);
    ctx.arcTo(x, y, x + r, y, r);
    ctx.closePath();
  }

  // 饼图的触摸命中检测:计算触摸点与圆心的角度和距离
  private hitTest(x: number, y: number): number {
    const width = this.canvasCtx.width;
    const height = this.canvasCtx.height;
    const radius = Math.min(width, height) / 2 - this.padding;
    const centerX = width / 2;
    const centerY = height / 2;

    // 计算触摸点到圆心的距离
    const dx = x - centerX;
    const dy = y - centerY;
    const dist = Math.sqrt(dx * dx + dy * dy);

    // 如果在半径范围内,计算角度
    if (dist > radius) return -1;

    // 计算角度(atan2 范围 -PI ~ PI,需要转换到 0 ~ 2PI)
    let angle = Math.atan2(dy, dx);
    if (angle < -Math.PI / 2) {
      angle += Math.PI * 2;
    }
    // 因为我们从 -PI/2 开始,所以要补偿
    const adjustedAngle = angle + Math.PI / 2;
    // 范围修正到 0 ~ 2PI
    let normalizedAngle = adjustedAngle;
    if (normalizedAngle < 0) normalizedAngle += Math.PI * 2;

    // 遍历每个扇形的角度范围
    const total = this.data.reduce((sum, item) => sum + item.value, 0);
    let currentAngle = 0;
    for (let i = 0; i < this.data.length; i++) {
      const sliceAngle = (this.data[i].value / total) * Math.PI * 2;
      const endAngle = currentAngle + sliceAngle;
      if (normalizedAngle >= currentAngle && normalizedAngle < endAngle) {
        return i;
      }
      currentAngle = endAngle;
    }
    return -1;
  }

  onTouch(event: TouchEvent): void {
    const touch = event.touches[0];
    if (!touch) return;

    const rect = touch.target!.getBoundingClientRect();
    if (!rect) return;
    const x = touch.x - rect.left;
    const y = touch.y - rect.top;

    if (event.type === TouchType.Down) {
      const hitIndex = this.hitTest(x, y);
      if (hitIndex >= 0) {
        this.selectedIndex = hitIndex;
        this.tooltipVisible = true;
        this.tooltipX = x;
        this.tooltipY = y;
      } else {
        this.selectedIndex = -1;
        this.tooltipVisible = false;
      }
    }
  }

  build() {
    Column() {
      Canvas(this.canvasCtx)
        .width('100%')
        .height(300)
        .onReady(() => {
          this.drawChart();
        })
        .onTouch((event: TouchEvent) => {
          this.onTouch(event);
        })
    }
    .onClick(() => {
      this.selectedIndex = -1;
      this.tooltipVisible = false;
    })
    .clip(true)
  }
}
饼图关键点说明
扇形角度计算与路径闭合: 每个扇形用 moveTo 到圆心,然后 arc 画出弧线,最后 closePath 回到圆心。这个顺序不能错——如果先 arc 后 moveTo,路径起始点不同,闭合时会多出一条从圆心到弧起始点的线。另外 closePath 用的是直线回到路径起点,所以圆心必须在 arc 之前用 moveTo 定位。
12 点钟方向起点: 角度从 -Math.PI / 2 开始,这样第一个扇形从正上方往下排,符合饼图的阅读习惯。如果从 0 开始(三点钟方向),视觉上会偏右。
动画进度与扇形绘制: 展开动画需要跟踪当前已绘制的总角度 drawnAngle,每个扇形只画到动画进度允许的范围。注意这里的逻辑:如果进度不够画完当前扇形,就只画一部分;remaining 归零后后续扇形直接跳过。
选中扇形外扩(explode 效果): 当 selectedIndex 匹配时,扇形沿中位线方向偏移 8px。这里用了 ctx.save/restore 包裹 translate,不影响后续绘制。
在页面中使用
两个组件准备好之后,在页面中组合使用:
// ChartPage.ets
import { BarChart } from './BarChart';
import { PieChart } from './PieChart';
import { ChartItem } from './ChartData';

@Entry
@Component
struct ChartPage {
  @State chartData: ChartItem[] = [
    { label: '一月', value: 120, color: '#007AFF' },
    { label: '二月', value: 200, color: '#FF9500' },
    { label: '三月', value: 150, color: '#34C759' },
    { label: '四月', value: 280, color: '#FF3B30' },
    { label: '五月', value: 180, color: '#AF52DE' },
  ];

  build() {
    Scroll() {
      Column() {
        Text('柱状图')
          .fontSize(18)
          .fontWeight(FontWeight.Bold)
          .margin({ top: 16, bottom: 8 })

        BarChart({ data: this.chartData })
          .width('100%')
          .height(340)
          .padding(8)
          .backgroundColor('#FFFFFF')
          .borderRadius(12)

        Blank().height(24)

        Text('饼图')
          .fontSize(18)
          .fontWeight(FontWeight.Bold)
          .margin({ top: 8, bottom: 8 })

        PieChart({ data: this.chartData })
          .width('100%')
          .height(360)
          .padding(8)
          .backgroundColor('#FFFFFF')
          .borderRadius(12)
      }
      .padding(16)
      .width('100%')
    }
    .backgroundColor('#F5F5F5')
  }
}
踩坑记录
1. Canvas 坐标与触摸坐标不一致
这是图表开发里最容易被新手忽视的问题。TouchEvent 中的 x 和 y 是相对于屏幕的全局坐标,而 Canvas 绘制的坐标是相对于画布本身的。如果在 onTouch 中直接用 event.x 去做 hitTest,触摸点会整体偏移,偏差值等于 Canvas 组件距离屏幕左上角的距离。
解决方案: 通过 touch.target!.getBoundingClientRect() 获取 Canvas 组件的屏幕位置,然后用 touch.x - rect.left 和 touch.y - rect.top 做转换。
2. 饼图接近 360° 时扇形路径异常
当某个数据的占比接近 100%(比如 99.8%),对应的扇形角度接近 2 * Math.PI。这时候 arc 的起始点和终止点几乎重合,closePath 画出来的线会出现一个微小的"缺口",视觉上就是一条细细的白线。
解决方案: 在绘制前做一个容差处理——如果某个扇形的角度大于 Math.PI * 2 - 0.001,直接画一个完整的圆(用 arc 的整个圆路径,不走 moveTo + closePath 路线),或者在这个接近满圆的扇形上覆盖一层稍大一圈的背景色路径。
3. 动画重入问题
如果 data 在动画播放中被重新赋值(比如数据动态更新),startAnimation 会被再次调用,导致上一轮动画和这一轮动画的 requestAnimationFrame 同时运行,animProgress 被两个循环交替覆盖。
解决方案: 在 startAnimation 开头加一个 animProgress = 0 重置,同时用一个标志量 private isAnimating: boolean = false 来保证同一时间只有一个动画循环在运行。更彻底的做法是用 @Watch 监听 data 变化,只在数据真正改变时才重启动画。
@Prop @Watch('onDataChange') data: ChartItem[] = [];
private isAnimating: boolean = false;

onDataChange(): void {
  // 数据变化时重新开始动画
  this.startAnimation();
}

startAnimation(): void {
  if (this.isAnimating) return; // 防止重入
  this.isAnimating = true;
  this.animProgress = 0;
  this.startTime = Date.now();
  const step = () => {
    const elapsed = Date.now() - this.startTime;
    const progress = Math.min(elapsed / this.animDuration, 1);
    this.animProgress = progress;
    if (progress < 1) {
      requestAnimationFrame(step);
    } else {
      this.isAnimating = false;
    }
  };
  requestAnimationFrame(step);
}
示例代码地址:项目地址
最佳实践
不要在 build() 中直接调用 drawChart()。 Canvas 的重绘应该由 onReady 触发,@State 变量变化时 ArkUI 自动调用 build(),再由 Canvas 的内部机制触发重绘。如果在 build() 里显式调用 drawChart(),会在组件初始化和状态变化时重复绘制,造成性能浪费。
动画时长控制在 600-1000ms 之间。 太短(<300ms)用户感知不到入场效果,太长(>1500ms)用户会等得不耐烦。柱状图 800ms、饼图 1000ms 是比较合适的区间。
饼图的文字标签只在扇形足够大时显示。 小于 30°(约 0.5 rad)的扇形区域不足以容纳百分比文字,硬要显示会导致文字重叠。可以用 drawAngle > 0.3 或 sliceAngle > 0.4 作为过滤条件,剩余数据在图例中展示。
坐标轴刻度数固定为 5 档是足够了。 刻度太多会让图表显得杂乱,刻度太少又不够精确。5 档(0、25%、50%、75%、100%)在大多数业务场景下能清晰表达数据分布。
总结
柱状图和饼图看起来是基础图表,但在 HarmonyOS Canvas 上完整实现一套可交互、带动画的组件,涉及的知识点其实不少:坐标系统转换、角度计算与路径闭合、动画进度与渲染同步、触摸命中检测与坐标补偿。把这些细节处理好,后续扩展折线图、雷达图、K 线图也只是类似的模式复用。
两个组件都采用 @Prop 接收数据、@State 管理动画/交互状态的模式,数据驱动渲染,不需要手动管理 Canvas 的刷新时机。如果你在实际使用中遇到触摸不准确或动画卡顿的问题,优先检查坐标转换和动画重入这两块,90% 的问题出在这里。
讨论HarmonyOS开发技术,专注于API与组件、DevEco Studio、测试、元服务和应用上架分发等。
更多推荐


 2
2 0
0- 0


 已为社区贡献41条内容

所有评论(0)