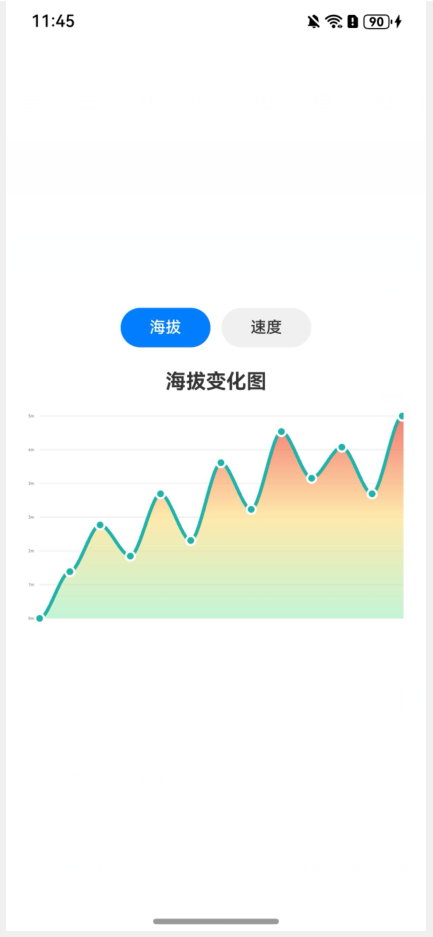
鸿蒙中渐变面积图(折线图)
·
// 定义接口
interface Point {
  x: number
  y: number
  value: number
}

// 图表绘制类
class ChartRenderer {
  private context: CanvasRenderingContext2D
  private canvasWidth: number = 370
  private canvasHeight: number = 200
  private padding: number = 10

  constructor(context: CanvasRenderingContext2D) {
    this.context = context
  }

  // 绘制完整图表
  drawChart(data: number[], dataType: 'altitude' | 'speed') {
    if (!data || data.length === 0) {
      return
    }

    const chartWidth = this.canvasWidth - 2 * this.padding
    const chartHeight = this.canvasHeight - 2 * this.padding

    // 清空画布
    this.context.clearRect(0, 0, this.canvasWidth, this.canvasHeight)

    // 绘制背景
    this.context.fillStyle = '#ffffff'
    this.context.fillRect(0, 0, this.canvasWidth, this.canvasHeight)

    // 绘制网格线
    this.drawGridLines()

    // 计算数据点坐标
    const points = this.calculatePoints(data, chartWidth, chartHeight)

    // 绘制渐变填充区域
    this.drawGradientArea(points, chartHeight)

    // 绘制平滑弧线
    this.drawSmoothLine(points)

    // 绘制数据点
    this.drawDataPoints(points)

    // 绘制Y轴标签
    this.drawYAxisLabels(data, dataType)
  }

  private drawGridLines() {
    this.context.strokeStyle = '#f0f0f0'
    this.context.lineWidth = 1

    // 绘制水平网格线 - 6条线
    for (let i = 0; i <= 6; i++) {
      const y = this.padding + (this.canvasHeight - 2 * this.padding) * i / 6
      this.context.beginPath()
      this.context.moveTo(this.padding, y)
      this.context.lineTo(this.canvasWidth - this.padding, y)
      this.context.stroke()
    }
  }

  private drawYAxisLabels(data: number[], dataType: 'altitude' | 'speed') {
    const maxValue = Math.max(...data)
    const minValue = Math.min(...data)
    const valueRange = maxValue - minValue

    this.context.fillStyle = '#666666'
    this.context.font = '12px Arial'
    this.context.textAlign = 'right'
    this.context.textBaseline = 'middle'

    // 绘制Y轴标签
    for (let i = 0; i <= 6; i++) {
      const y = this.padding + (this.canvasHeight - 2 * this.padding) * i / 6
      const value = minValue + (valueRange * (6 - i) / 6)
      const label = dataType === 'altitude' ? `${Math.round(value)}m` : `${Math.round(value)}km/h`

      this.context.fillText(label, this.padding - 5, y)
    }
  }

  private calculatePoints(data: number[], chartWidth: number, chartHeight: number): Point[] {
    const maxValue = Math.max(...data)
    const minValue = Math.min(...data)
    const valueRange = maxValue - minValue

    const points: Point[] = []
    for (let i = 0; i < data.length; i++) {
      const value = data[i]
      const x = this.padding + (chartWidth * i) / (data.length - 1)
      const y = this.padding + chartHeight - ((value - minValue) / valueRange) * chartHeight
      points.push({ x: x, y: y, value: value })
    }
    return points
  }

  private drawGradientArea(points: Point[], chartHeight: number) {
    const gradient = this.context.createLinearGradient(0, this.padding, 0, this.padding + chartHeight)
    gradient.addColorStop(0, 'rgba(240, 68, 56, 0.7)') // #F04438
    gradient.addColorStop(0.5, 'rgba(254, 223, 137, 0.7)') // #FEDF89
    gradient.addColorStop(1, 'rgba(171, 239, 198, 0.7)') // #ABEFC6

    this.context.fillStyle = gradient
    this.context.beginPath()
    this.context.moveTo(points[0].x, this.padding + chartHeight)
    this.context.lineTo(points[0].x, points[0].y)
    this.drawSmoothPath(points, false)
    this.context.lineTo(points[points.length - 1].x, this.padding + chartHeight)
    this.context.closePath()
    this.context.fill()
  }

  private drawSmoothLine(points: Point[]) {
    this.context.strokeStyle = '#20b2aa'
    this.context.lineWidth = 3
    this.context.lineCap = 'round'
    this.context.lineJoin = 'round'

    this.context.beginPath()
    this.context.moveTo(points[0].x, points[0].y)
    this.drawSmoothPath(points, true)
    this.context.stroke()
  }

  private drawSmoothPath(points: Point[], isStroke: boolean) {
    if (points.length < 2) {
      return
    }

    for (let i = 0; i < points.length - 1; i++) {
      const currentPoint = points[i]
      const nextPoint = points[i + 1]
      const cp1X = currentPoint.x + (nextPoint.x - currentPoint.x) * 0.3
      const cp1Y = currentPoint.y
      const cp2X = nextPoint.x - (nextPoint.x - currentPoint.x) * 0.3
      const cp2Y = nextPoint.y

      if (isStroke) {
        this.context.bezierCurveTo(cp1X, cp1Y, cp2X, cp2Y, nextPoint.x, nextPoint.y)
      } else {
        this.context.bezierCurveTo(cp1X, cp1Y, cp2X, cp2Y, nextPoint.x, nextPoint.y)
      }
    }
  }

  private drawDataPoints(points: Point[]) {
    this.context.fillStyle = '#20b2aa'

    for (let i = 0; i < points.length; i++) {
      const point = points[i]
      this.context.beginPath()
      this.context.arc(point.x, point.y, 4, 0, 2 * Math.PI)
      this.context.fill()

      this.context.strokeStyle = '#ffffff'
      this.context.lineWidth = 2
      this.context.stroke()
    }
  }
}

// 公共图表组件
@Component
export struct AreaChartComponent {
  @Prop @Watch('onDataChange') data: number[]
  @Prop @Watch('onDataTypeChange') dataType: 'altitude' | 'speed'
  private context: CanvasRenderingContext2D = new CanvasRenderingContext2D()
  private chartRenderer: ChartRenderer | null = null

  aboutToAppear() {
    console.log('AreaChartComponent initialized with data:', JSON.stringify(this.data))
  }

  // 监听数据变化
  onDataChange() {
    this.scheduleDrawChart()
  }

  // 监听数据类型变化
  onDataTypeChange() {
    this.scheduleDrawChart()
  }

  build() {
    Canvas(this.context)
      .width('100%')
      .height(200)
      .backgroundColor('#ffffff')
      .onReady(() => {
        this.chartRenderer = new ChartRenderer(this.context)
        this.drawChart()
      })
  }

  // 延迟绘制图表,确保Canvas已准备好
  private scheduleDrawChart() {
    // 使用setTimeout确保在组件更新完成后执行
    setTimeout(() => {
      this.drawChart()
    }, 0)
  }

  // 绘制图表
  private drawChart() {
    if (!this.chartRenderer) {
      console.warn('ChartRenderer not initialized yet')
      return
    }

    const currentData =
      this.data && this.data.length > 0 ? this.data : [20, 35, 25, 60, 80, 45, 30, 50, 40, 25, 15, 35, 20, 10]
    const currentDataType = this.dataType || 'altitude'

    console.log('Drawing chart with data:', currentData, 'type:', currentDataType)
    this.chartRenderer.drawChart(currentData, currentDataType)
  }
}

// 父组件
@Entry
@Component
struct AreaChart {
  @State data: number[] = [120, 135, 150, 140, 160, 145, 170, 155, 180, 165, 175, 160, 185, 170]
  @State dataType: 'altitude' | 'speed' = 'altitude'
  // 海拔数据 (米) - 缓慢起伏,整体平稳,模拟山地地形
  private altitudeData: number[] = [120, 135, 150, 140, 160, 145, 170, 155, 180, 165, 175, 160, 185, 170]
  // 速度数据 (km/h) - 快速波动,有急加速和急减速,模拟城市驾驶
  private speedData: number[] = [15, 45, 25, 60, 20, 55, 30, 70, 15, 50, 35, 65, 25, 40]

  aboutToAppear() {
    console.log('AreaChart parent component initialized')
  }

  build() {
    Column() {
      // 切换按钮
      Row() {
        Button('海拔')
          .onClick(() => {
            this.switchToAltitude()
          })
          .backgroundColor(this.dataType === 'altitude' ? '#007DFF' : '#f0f0f0')
          .fontColor(this.dataType === 'altitude' ? Color.White : '#333333')
          .borderRadius(20)
          .fontSize(14)
          .fontWeight(FontWeight.Medium)
          .width(80)
          .height(35)
          .margin({ right: 10 })

        Button('速度')
          .onClick(() => {
            this.switchToSpeed()
          })
          .backgroundColor(this.dataType === 'speed' ? '#007DFF' : '#f0f0f0')
          .fontColor(this.dataType === 'speed' ? Color.White : '#333333')
          .borderRadius(20)
          .fontSize(14)
          .fontWeight(FontWeight.Medium)
          .width(80)
          .height(35)
      }
      .justifyContent(FlexAlign.Center)
      .margin({ bottom: 20 })

      // 图表组件
      AreaChartComponent({
        data: this.data,
        dataType: this.dataType
      })
    }
    .width('100%')
    .height('100%')
    .justifyContent(FlexAlign.Center)
    .padding(20)
  }

  // 切换到海拔数据
  private switchToAltitude() {
    console.log('Switching to altitude data')
    this.dataType = 'altitude'
    this.data = this.altitudeData
  }

  // 切换到速度数据
  private switchToSpeed() {
    console.log('Switching to speed data')
    this.dataType = 'speed'
    this.data = this.speedData
  }
}

讨论HarmonyOS开发技术,专注于API与组件、DevEco Studio、测试、元服务和应用上架分发等。
更多推荐


 2
2 0
0- 0


 已为社区贡献23条内容

所有评论(0)