Flutter 框架跨平台鸿蒙开发 - 免费电子书下载器:智能搜索与离线阅读
Flutter实时潮汐查询:智能预测潮汐时间
项目简介
实时潮汐查询是一款专为沿海地区用户打造的Flutter应用,帮助用户查询潮汐时间、潮高数据和月相信息。通过智能预测和可视化展示,让出海、垂钓、观潮等活动更加安全便捷。
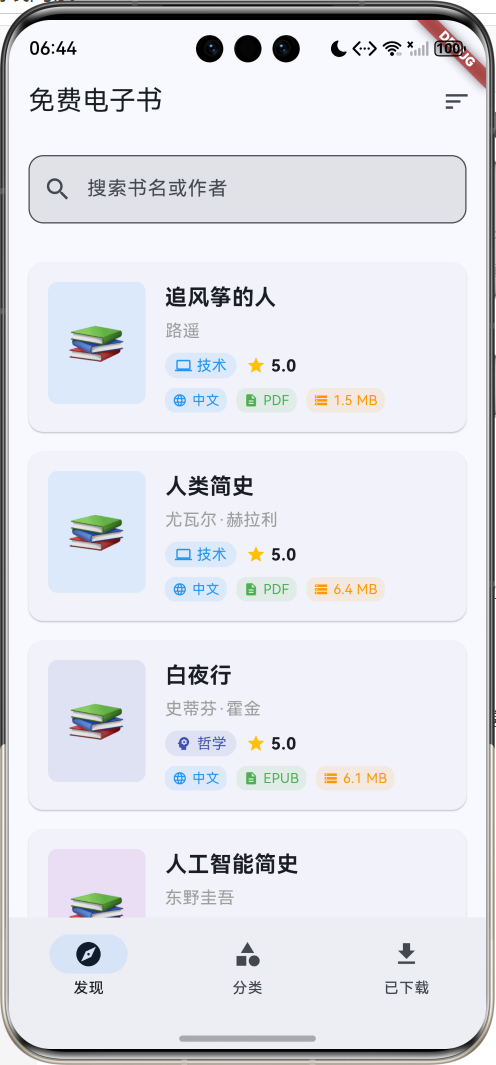
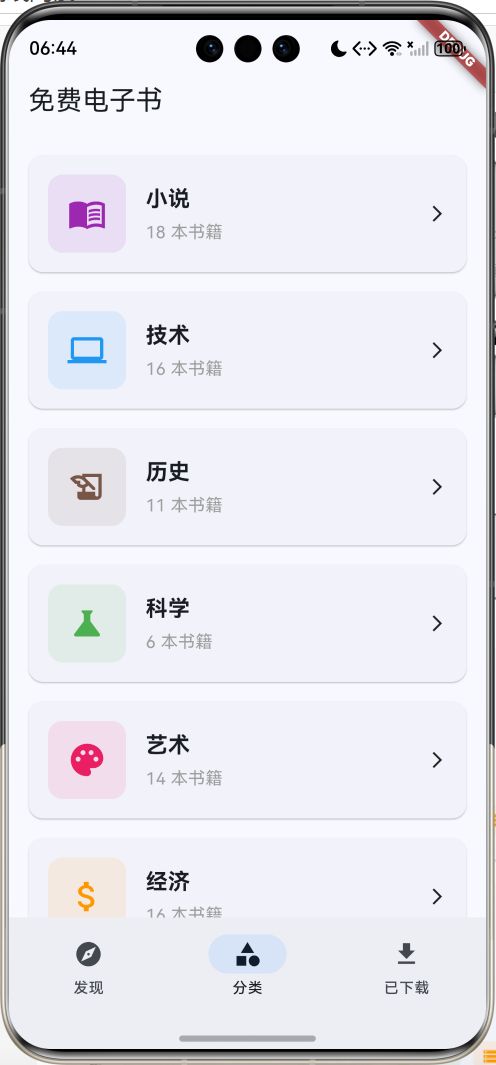
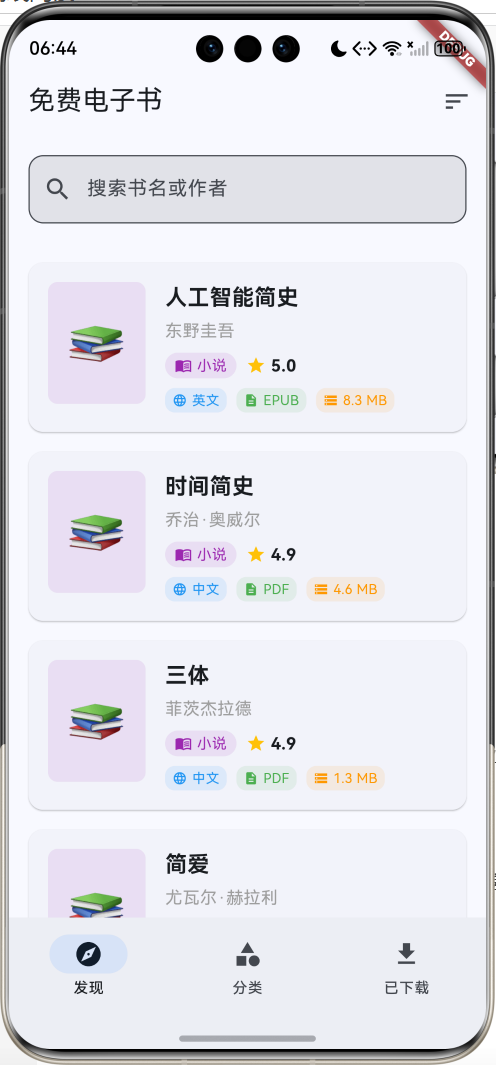
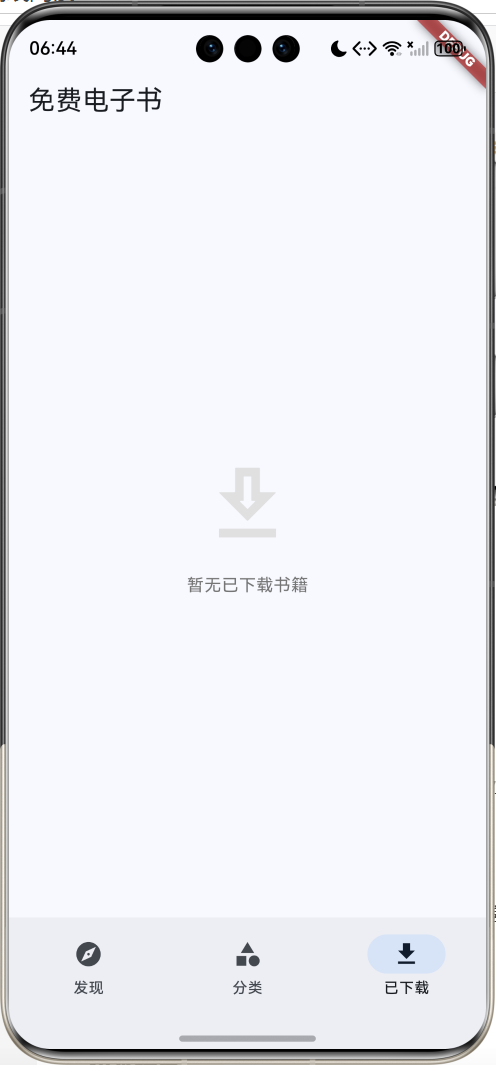
运行效果图
核心功能
- 城市选择:支持10个沿海城市查询
- 潮汐预测:显示未来3/7/15天潮汐数据
- 时刻表:每日高潮低潮时间精确到分钟
- 潮高数据:显示潮位高度(米)
- 潮汐等级:特大潮、大潮、中潮、平潮、小潮
- 月相信息:显示当日月相及其影响
- 潮汐曲线:可视化展示潮汐变化趋势
- 潮差计算:自动计算最高潮位与最低潮位差
- 知识科普:潮汐相关知识介绍
- 数据刷新:实时更新潮汐数据
技术特点
- Material Design 3设计风格
- 自定义Canvas绘制潮汐曲线
- 多城市数据模拟
- 月相可视化展示
- 响应式卡片布局
- 详细的数据展示
- 科普知识集成
核心代码实现
1. 沿海城市数据模型
class CoastalCity {
  String name;              // 城市名称
  String province;          // 省份
  double latitude;          // 纬度
  double longitude;         // 经度
  String timezone;          // 时区

  CoastalCity({
    required this.name,
    required this.province,
    required this.latitude,
    required this.longitude,
    required this.timezone,
  });
}
模型字段说明:
| 字段 | 类型 | 说明 |
|---|---|---|
| name | String | 城市名称 |
| province | String | 所属省份 |
| latitude | double | 纬度坐标 |
| longitude | double | 经度坐标 |
| timezone | String | 时区信息 |
支持城市列表:
| 城市 | 省份 | 纬度 | 经度 |
|---|---|---|---|
| 上海 | 上海市 | 31.2304 | 121.4737 |
| 青岛 | 山东省 | 36.0671 | 120.3826 |
| 大连 | 辽宁省 | 38.9140 | 121.6147 |
| 厦门 | 福建省 | 24.4798 | 118.0894 |
| 深圳 | 广东省 | 22.5431 | 114.0579 |
| 广州 | 广东省 | 23.1291 | 113.2644 |
| 宁波 | 浙江省 | 29.8683 | 121.5440 |
| 天津 | 天津市 | 39.0842 | 117.2010 |
| 烟台 | 山东省 | 37.4638 | 121.4478 |
| 海口 | 海南省 | 20.0444 | 110.1999 |
2. 潮汐数据模型
class TideData {
  DateTime time;            // 潮汐时间
  String type;              // 类型(high/low)
  double height;            // 潮高(米)
  String level;             // 等级

  TideData({
    required this.time,
    required this.type,
    required this.height,
    required this.level,
  });

  // 类型文本
  String get typeText {
    switch (type) {
      case 'high':
        return '高潮';
      case 'low':
        return '低潮';
      default:
        return '未知';
    }
  }

  // 类型颜色
  Color get typeColor {
    switch (type) {
      case 'high':
        return Colors.blue;
      case 'low':
        return Colors.orange;
      default:
        return Colors.grey;
    }
  }

  // 类型图标
  IconData get typeIcon {
    switch (type) {
      case 'high':
        return Icons.arrow_upward;
      case 'low':
        return Icons.arrow_downward;
      default:
        return Icons.remove;
    }
  }

  // 等级文本
  String get levelText {
    switch (level) {
      case 'extreme_high':
        return '特大潮';
      case 'very_high':
        return '大潮';
      case 'high':
        return '中潮';
      case 'normal':
        return '平潮';
      case 'low':
        return '小潮';
      default:
        return '未知';
    }
  }

  // 等级颜色
  Color get levelColor {
    switch (level) {
      case 'extreme_high':
        return Colors.red;
      case 'very_high':
        return Colors.deepOrange;
      case 'high':
        return Colors.orange;
      case 'normal':
        return Colors.blue;
      case 'low':
        return Colors.green;
      default:
        return Colors.grey;
    }
  }
}
模型字段说明:
| 字段 | 类型 | 说明 |
|---|---|---|
| time | DateTime | 潮汐发生时间 |
| type | String | 潮汐类型(high/low) |
| height | double | 潮位高度(米) |
| level | String | 潮汐等级 |
计算属性:
typeText:返回类型中文描述typeColor:返回类型对应颜色typeIcon:返回类型对应图标levelText:返回等级中文描述levelColor:返回等级对应颜色
潮汐类型:
| 类型 | 说明 | 颜色 | 图标 |
|---|---|---|---|
| high | 高潮 | 蓝色 | arrow_upward |
| low | 低潮 | 橙色 | arrow_downward |
潮汐等级:
| 等级 | 说明 | 潮高范围 | 颜色 |
|---|---|---|---|
| extreme_high | 特大潮 | >4.5m | 红色 |
| very_high | 大潮 | 4.0-4.5m | 深橙色 |
| high | 中潮 | 3.0-4.0m | 橙色 |
| normal | 平潮 | 2.0-3.0m | 蓝色 |
| low | 小潮 | <2.0m | 绿色 |
3. 每日潮汐数据模型
class DailyTide {
  DateTime date;            // 日期
  List<TideData> tides;     // 潮汐列表
  double maxHeight;         // 最高潮位
  double minHeight;         // 最低潮位
  String moonPhase;         // 月相

  DailyTide({
    required this.date,
    required this.tides,
    required this.maxHeight,
    required this.minHeight,
    required this.moonPhase,
  });

  // 日期文本
  String get dateText {
    final weekdays = ['周一', '周二', '周三', '周四', '周五', '周六', '周日'];
    return '${date.month}月${date.day}日 ${weekdays[date.weekday - 1]}';
  }

  // 月相图标
  IconData get moonIcon {
    switch (moonPhase) {
      case 'new':
        return Icons.brightness_1;
      case 'waxing_crescent':
        return Icons.brightness_2;
      case 'first_quarter':
        return Icons.brightness_3;
      case 'waxing_gibbous':
        return Icons.brightness_4;
      case 'full':
        return Icons.brightness_5;
      case 'waning_gibbous':
        return Icons.brightness_6;
      case 'last_quarter':
        return Icons.brightness_7;
      case 'waning_crescent':
        return Icons.brightness_2;
      default:
        return Icons.brightness_1;
    }
  }

  // 月相文本
  String get moonPhaseText {
    switch (moonPhase) {
      case 'new':
        return '新月';
      case 'waxing_crescent':
        return '娥眉月';
      case 'first_quarter':
        return '上弦月';
      case 'waxing_gibbous':
        return '盈凸月';
      case 'full':
        return '满月';
      case 'waning_gibbous':
        return '亏凸月';
      case 'last_quarter':
        return '下弦月';
      case 'waning_crescent':
        return '残月';
      default:
        return '未知';
    }
  }
}
模型字段说明:
| 字段 | 类型 | 说明 |
|---|---|---|
| date | DateTime | 日期 |
| tides | List | 当日潮汐列表 |
| maxHeight | double | 最高潮位(米) |
| minHeight | double | 最低潮位(米) |
| moonPhase | String | 月相类型 |
计算属性:
dateText:返回格式化日期文本moonIcon:返回月相对应图标moonPhaseText:返回月相中文名称
月相类型:
| 月相 | 中文名 | 图标 | 说明 |
|---|---|---|---|
| new | 新月 | brightness_1 | 月球位于太阳和地球之间 |
| waxing_crescent | 娥眉月 | brightness_2 | 新月之后的月牙 |
| first_quarter | 上弦月 | brightness_3 | 月球右半边被照亮 |
| waxing_gibbous | 盈凸月 | brightness_4 | 上弦月之后 |
| full | 满月 | brightness_5 | 月球完全被照亮 |
| waning_gibbous | 亏凸月 | brightness_6 | 满月之后 |
| last_quarter | 下弦月 | brightness_7 | 月球左半边被照亮 |
| waning_crescent | 残月 | brightness_2 | 下弦月之后 |
4. 潮汐数据生成
void _generateTideData() {
  if (_selectedCity == null) return;

  final random = Random();
  final moonPhases = [
    'new', 'waxing_crescent', 'first_quarter', 'waxing_gibbous',
    'full', 'waning_gibbous', 'last_quarter', 'waning_crescent'
  ];

  _dailyTides = List.generate(_selectedDays, (dayIndex) {
    final date = _selectedDate.add(Duration(days: dayIndex));
    final tides = <TideData>[];

    // 每天生成4次潮汐(2次高潮2次低潮)
    final tideCount = 4;
    final baseHour = 6;

    for (int i = 0; i < tideCount; i++) {
      final isHigh = i % 2 == 0;
      final hour = baseHour + (i * 6) + random.nextInt(2) - 1;
      final minute = random.nextInt(60);

      final height = isHigh
          ? 2.5 + random.nextDouble() * 2.5  // 高潮:2.5-5.0m
          : 0.5 + random.nextDouble() * 1.0; // 低潮:0.5-1.5m

      String level;
      if (height > 4.5) {
        level = 'extreme_high';
      } else if (height > 4.0) {
        level = 'very_high';
      } else if (height > 3.0) {
        level = 'high';
      } else if (height > 2.0) {
        level = 'normal';
      } else {
        level = 'low';
      }

      tides.add(TideData(
        time: DateTime(date.year, date.month, date.day, hour, minute),
        type: isHigh ? 'high' : 'low',
        height: height,
        level: level,
      ));
    }

    tides.sort((a, b) => a.time.compareTo(b.time));

    final maxHeight = tides
        .where((t) => t.type == 'high')
        .map((t) => t.height)
        .reduce((a, b) => a > b ? a : b);
    final minHeight = tides
        .where((t) => t.type == 'low')
        .map((t) => t.height)
        .reduce((a, b) => a < b ? a : b);

    return DailyTide(
      date: date,
      tides: tides,
      maxHeight: maxHeight,
      minHeight: minHeight,
      moonPhase: moonPhases[(dayIndex + random.nextInt(3)) % moonPhases.length],
    );
  });

  setState(() {});
}
数据生成逻辑:
- 每天生成4次潮汐(2次高潮、2次低潮)
- 高潮时间:约6:00、18:00(±1小时)
- 低潮时间:约12:00、24:00(±1小时)
- 高潮潮高:2.5-5.0米
- 低潮潮高:0.5-1.5米
- 根据潮高自动判定等级
- 按时间排序
- 计算最高潮位和最低潮位
- 随机分配月相
潮汐规律:
- 一天通常有2次高潮和2次低潮
- 高潮和低潮间隔约6小时
- 相邻两天的潮汐时间推迟约50分钟
- 月相影响潮汐大小
5. 城市选择对话框
void _selectCity() {
  showModalBottomSheet(
    context: context,
    builder: (context) => Container(
      padding: const EdgeInsets.all(16),
      child: Column(
        mainAxisSize: MainAxisSize.min,
        crossAxisAlignment: CrossAxisAlignment.start,
        children: [
          const Text(
            '选择城市',
            style: TextStyle(fontSize: 18, fontWeight: FontWeight.bold),
          ),
          const SizedBox(height: 16),
          Expanded(
            child: ListView.builder(
              itemCount: _cities.length,
              itemBuilder: (context, index) {
                final city = _cities[index];
                return ListTile(
                  leading: const Icon(Icons.location_city),
                  title: Text(city.name),
                  subtitle: Text(city.province),
                  trailing: _selectedCity?.name == city.name
                      ? const Icon(Icons.check, color: Colors.blue)
                      : null,
                  onTap: () {
                    setState(() {
                      _selectedCity = city;
                      _generateTideData();
                    });
                    Navigator.pop(context);
                  },
                );
              },
            ),
          ),
        ],
      ),
    ),
  );
}
交互设计:
- 使用ModalBottomSheet展示城市列表
- ListView.builder实现可滚动列表
- 显示城市名称和省份
- 选中城市显示勾选图标
- 选择后自动关闭对话框并刷新数据
6. 查询天数选择
void _selectDateRange() {
  showModalBottomSheet(
    context: context,
    builder: (context) => Container(
      padding: const EdgeInsets.all(16),
      child: Column(
        mainAxisSize: MainAxisSize.min,
        crossAxisAlignment: CrossAxisAlignment.start,
        children: [
          const Text(
            '选择查询天数',
            style: TextStyle(fontSize: 18, fontWeight: FontWeight.bold),
          ),
          const SizedBox(height: 16),
          RadioListTile<int>(
            title: const Text('未来3天'),
            value: 3,
            groupValue: _selectedDays,
            onChanged: (value) {
              setState(() {
                _selectedDays = value!;
                _generateTideData();
              });
              Navigator.pop(context);
            },
          ),
          RadioListTile<int>(
            title: const Text('未来7天'),
            value: 7,
            groupValue: _selectedDays,
            onChanged: (value) {
              setState(() {
                _selectedDays = value!;
                _generateTideData();
              });
              Navigator.pop(context);
            },
          ),
          RadioListTile<int>(
            title: const Text('未来15天'),
            value: 15,
            groupValue: _selectedDays,
            onChanged: (value) {
              setState(() {
                _selectedDays = value!;
                _generateTideData();
              });
              Navigator.pop(context);
            },
          ),
        ],
      ),
    ),
  );
}
查询天数选项:
- 未来3天:短期预测,适合近期出海
- 未来7天:一周预测,适合周计划
- 未来15天:半月预测,适合长期规划
7. 每日潮汐卡片
Widget _buildDailyTideCard(DailyTide dailyTide) {
  return Card(
    margin: const EdgeInsets.only(bottom: 16),
    child: InkWell(
      onTap: () {
        Navigator.push(
          context,
          MaterialPageRoute(
            builder: (_) => TideDetailPage(
              city: _selectedCity!,
              dailyTide: dailyTide,
            ),
          ),
        );
      },
      child: Padding(
        padding: const EdgeInsets.all(16),
        child: Column(
          crossAxisAlignment: CrossAxisAlignment.start,
          children: [
            // 顶部:月相、日期、最高最低潮位
            Row(
              children: [
                Container(
                  padding: const EdgeInsets.all(8),
                  decoration: BoxDecoration(
                    color: Colors.blue.withValues(alpha: 0.1),
                    borderRadius: BorderRadius.circular(8),
                  ),
                  child: Icon(
                    dailyTide.moonIcon,
                    color: Colors.blue,
                    size: 24,
                  ),
                ),
                const SizedBox(width: 12),
                Expanded(
                  child: Column(
                    crossAxisAlignment: CrossAxisAlignment.start,
                    children: [
                      Text(
                        dailyTide.dateText,
                        style: const TextStyle(
                          fontSize: 18,
                          fontWeight: FontWeight.bold,
                        ),
                      ),
                      Text(
                        dailyTide.moonPhaseText,
                        style: const TextStyle(
                          fontSize: 14,
                          color: Colors.grey,
                        ),
                      ),
                    ],
                  ),
                ),
                Column(
                  crossAxisAlignment: CrossAxisAlignment.end,
                  children: [
                    Row(
                      children: [
                        const Icon(Icons.arrow_upward,
                            size: 16, color: Colors.blue),
                        Text(
                          '${dailyTide.maxHeight.toStringAsFixed(2)}m',
                          style: const TextStyle(
                            fontSize: 14,
                            fontWeight: FontWeight.bold,
                            color: Colors.blue,
                          ),
                        ),
                      ],
                    ),
                    Row(
                      children: [
                        const Icon(Icons.arrow_downward,
                            size: 16, color: Colors.orange),
                        Text(
                          '${dailyTide.minHeight.toStringAsFixed(2)}m',
                          style: const TextStyle(
                            fontSize: 14,
                            fontWeight: FontWeight.bold,
                            color: Colors.orange,
                          ),
                        ),
                      ],
                    ),
                  ],
                ),
              ],
            ),
            const SizedBox(height: 16),
            const Divider(),
            const SizedBox(height: 8),
            // 潮汐时刻列表
            ...dailyTide.tides.map((tide) => _buildTideItem(tide)),
          ],
        ),
      ),
    ),
  );
}
卡片布局结构:
- 顶部:月相图标、日期、星期、最高最低潮位
- 分隔线
- 潮汐时刻列表(每个潮汐的时间、类型、潮高、等级)
8. 潮汐时刻项
Widget _buildTideItem(TideData tide) {
  return Container(
    margin: const EdgeInsets.only(bottom: 8),
    padding: const EdgeInsets.all(12),
    decoration: BoxDecoration(
      color: tide.typeColor.withValues(alpha: 0.1),
      borderRadius: BorderRadius.circular(8),
    ),
    child: Row(
      children: [
        Container(
          padding: const EdgeInsets.all(8),
          decoration: BoxDecoration(
            color: tide.typeColor,
            borderRadius: BorderRadius.circular(8),
          ),
          child: Icon(
            tide.typeIcon,
            color: Colors.white,
            size: 20,
          ),
        ),
        const SizedBox(width: 12),
        Expanded(
          child: Column(
            crossAxisAlignment: CrossAxisAlignment.start,
            children: [
              Text(
                tide.typeText,
                style: TextStyle(
                  fontSize: 16,
                  fontWeight: FontWeight.bold,
                  color: tide.typeColor,
                ),
              ),
              Text(
                '${tide.time.hour.toString().padLeft(2, '0')}:${tide.time.minute.toString().padLeft(2, '0')}',
                style: const TextStyle(
                  fontSize: 14,
                  color: Colors.grey,
                ),
              ),
            ],
          ),
        ),
        Column(
          crossAxisAlignment: CrossAxisAlignment.end,
          children: [
            Text(
              '${tide.height.toStringAsFixed(2)}m',
              style: TextStyle(
                fontSize: 18,
                fontWeight: FontWeight.bold,
                color: tide.typeColor,
              ),
            ),
            Container(
              padding: const EdgeInsets.symmetric(horizontal: 8, vertical: 2),
              decoration: BoxDecoration(
                color: tide.levelColor,
                borderRadius: BorderRadius.circular(12),
              ),
              child: Text(
                tide.levelText,
                style: const TextStyle(
                  fontSize: 12,
                  color: Colors.white,
                ),
              ),
            ),
          ],
        ),
      ],
    ),
  );
}
时刻项设计:
- 左侧:类型图标(高潮/低潮)
- 中间:类型文本、时间
- 右侧:潮高数值、等级标签
9. 潮汐详情页
class TideDetailPage extends StatelessWidget {
final CoastalCity city;
final DailyTide dailyTide;
const TideDetailPage({
super.key,
required this.city,
required this.dailyTide,
});
Widget build(BuildContext context) {
return Scaffold(
appBar: AppBar(
title: Text('${city.name} - ${dailyTide.dateText}'),
),
body: SingleChildScrollView(
child: Column(
crossAxisAlignment: CrossAxisAlignment.start,
children: [
_buildDateInfo(),
_buildTideChart(),
_buildTideList(),
_buildMoonInfo(),
_buildTideKnowledge(),
],
),
),
);
}
}
详情页结构:
- 日期信息卡片:日期、月相、最高最低潮位、潮差
- 潮汐曲线卡片:可视化展示潮汐变化
- 潮汐时刻表卡片:详细的时刻列表
- 月相信息卡片:月相图标、名称、描述
- 潮汐知识卡片:科普知识
10. 潮汐曲线绘制
class TideChartPainter extends CustomPainter {
final List<TideData> tides;
TideChartPainter(this.tides);
void paint(Canvas canvas, Size size) {
final paint = Paint()
..style = PaintingStyle.stroke
..strokeWidth = 3;
final maxHeight = tides.map((t) => t.height).reduce((a, b) => a > b ? a : b);
final minHeight = tides.map((t) => t.height).reduce((a, b) => a < b ? a : b);
final heightRange = maxHeight - minHeight;
final path = Path();
for (int i = 0; i < tides.length; i++) {
final x = (size.width / (tides.length - 1)) * i;
final y = size.height -
((tides[i].height - minHeight) / heightRange) * size.height;
if (i == 0) {
path.moveTo(x, y);
} else {
path.lineTo(x, y);
}
// 绘制点
paint.color = tides[i].typeColor;
canvas.drawCircle(Offset(x, y), 6, paint);
}
// 绘制曲线
paint.color = Colors.blue;
canvas.drawPath(path, paint);
// 绘制网格线
final gridPaint = Paint()
..color = Colors.grey.withValues(alpha: 0.3)
..strokeWidth = 1;
for (int i = 0; i <= 4; i++) {
final y = (size.height / 4) * i;
canvas.drawLine(Offset(0, y), Offset(size.width, y), gridPaint);
}
}
bool shouldRepaint(covariant CustomPainter oldDelegate) => true;
}
绘制逻辑:
- 计算最高和最低潮位
- 计算潮位范围
- 将潮高映射到画布坐标
- 绘制连接各点的曲线
- 绘制潮汐点(高潮蓝色、低潮橙色)
- 绘制网格线辅助阅读
坐标转换:
y = height - ((tideHeight - minHeight) / heightRange) * height
11. 月相信息展示
Widget _buildMoonInfo() {
  return Card(
    margin: const EdgeInsets.symmetric(horizontal: 16, vertical: 8),
    child: Padding(
      padding: const EdgeInsets.all(16),
      child: Column(
        crossAxisAlignment: CrossAxisAlignment.start,
        children: [
          const Row(
            children: [
              Icon(Icons.brightness_3, color: Colors.blue),
              SizedBox(width: 8),
              Text(
                '月相信息',
                style: TextStyle(fontSize: 18, fontWeight: FontWeight.bold),
              ),
            ],
          ),
          const SizedBox(height: 16),
          Row(
            children: [
              Container(
                padding: const EdgeInsets.all(24),
                decoration: BoxDecoration(
                  color: Colors.blue.withValues(alpha: 0.1),
                  borderRadius: BorderRadius.circular(16),
                ),
                child: Icon(
                  dailyTide.moonIcon,
                  size: 64,
                  color: Colors.blue,
                ),
              ),
              const SizedBox(width: 24),
              Expanded(
                child: Column(
                  crossAxisAlignment: CrossAxisAlignment.start,
                  children: [
                    Text(
                      dailyTide.moonPhaseText,
                      style: const TextStyle(
                        fontSize: 24,
                        fontWeight: FontWeight.bold,
                      ),
                    ),
                    const SizedBox(height: 8),
                    Text(
                      _getMoonPhaseDescription(dailyTide.moonPhase),
                      style: const TextStyle(
                        fontSize: 14,
                        color: Colors.grey,
                      ),
                    ),
                  ],
                ),
              ),
            ],
          ),
        ],
      ),
    ),
  );
}

String _getMoonPhaseDescription(String phase) {
  switch (phase) {
    case 'new':
      return '月球位于太阳和地球之间,朝向地球的一面不被太阳照亮。此时潮汐力较大,易形成大潮。';
    case 'first_quarter':
      return '月球、地球、太阳成直角,月球的右半边被照亮。此时潮汐力较小,易形成小潮。';
    case 'full':
      return '月球位于地球和太阳之间的对面,朝向地球的一面完全被太阳照亮。此时潮汐力最大,形成大潮。';
    case 'last_quarter':
      return '月球、地球、太阳再次成直角,月球的左半边被照亮。此时潮汐力较小,易形成小潮。';
    default:
      return '';
  }
}
月相与潮汐关系:
- 新月和满月:潮汐力最大,形成大潮
- 上弦月和下弦月:潮汐力较小,形成小潮
- 月相周期约29.5天
12. 潮汐知识科普
Widget _buildTideKnowledge() {
  return Card(
    margin: const EdgeInsets.all(16),
    child: Padding(
      padding: const EdgeInsets.all(16),
      child: Column(
        crossAxisAlignment: CrossAxisAlignment.start,
        children: [
          const Row(
            children: [
              Icon(Icons.info_outline, color: Colors.blue),
              SizedBox(width: 8),
              Text(
                '潮汐知识',
                style: TextStyle(fontSize: 18, fontWeight: FontWeight.bold),
              ),
            ],
          ),
          const SizedBox(height: 16),
          _buildKnowledgeItem(
            '什么是潮汐?',
            '潮汐是海水在天体(主要是月球和太阳)引潮力作用下所产生的周期性运动。',
          ),
          const SizedBox(height: 12),
          _buildKnowledgeItem(
            '高潮和低潮',
            '海水上涨到最高位置称为高潮,下降到最低位置称为低潮。一般每天有两次高潮和两次低潮。',
          ),
          const SizedBox(height: 12),
          _buildKnowledgeItem(
            '大潮和小潮',
            '农历初一、十五前后,月球、地球、太阳在一条直线上,引潮力最大,形成大潮。农历初八、二十三前后形成小潮。',
          ),
          const SizedBox(height: 12),
          _buildKnowledgeItem(
            '潮汐的影响',
            '潮汐影响航海、渔业、海洋工程等。了解潮汐规律对海上活动安全至关重要。',
          ),
        ],
      ),
    ),
  );
}

Widget _buildKnowledgeItem(String title, String content) {
  return Container(
    padding: const EdgeInsets.all(12),
    decoration: BoxDecoration(
      color: Colors.blue.withValues(alpha: 0.05),
      borderRadius: BorderRadius.circular(8),
    ),
    child: Column(
      crossAxisAlignment: CrossAxisAlignment.start,
      children: [
        Text(
          title,
          style: const TextStyle(
            fontSize: 16,
            fontWeight: FontWeight.bold,
          ),
        ),
        const SizedBox(height: 8),
        Text(
          content,
          style: const TextStyle(
            fontSize: 14,
            color: Colors.grey,
            height: 1.5,
          ),
        ),
      ],
    ),
  );
}
科普内容:
- 潮汐的定义和成因
- 高潮和低潮的概念
- 大潮和小潮的形成
- 潮汐对人类活动的影响
技术要点详解
1. CustomPainter自定义绘制
CustomPainter是Flutter中用于自定义绘制的强大工具。
基本用法:
class MyPainter extends CustomPainter {
void paint(Canvas canvas, Size size) {
// 绘制逻辑
}
bool shouldRepaint(covariant CustomPainter oldDelegate) => true;
}
// 使用
CustomPaint(
painter: MyPainter(),
child: Container(),
)
Canvas常用方法:
drawLine:绘制直线drawCircle:绘制圆形drawPath:绘制路径drawRect:绘制矩形drawText:绘制文本
Paint属性:
color:颜色strokeWidth:线宽style:样式(填充/描边)
使用场景:
- 图表绘制
- 自定义形状
- 动画效果
- 数据可视化
2. Path路径绘制
Path用于创建复杂的绘制路径。
基本用法:
final path = Path();
path.moveTo(x1, y1);  // 移动到起点
path.lineTo(x2, y2);  // 画线到终点
path.quadraticBezierTo(cx, cy, x, y);  // 二次贝塞尔曲线
path.cubicTo(cx1, cy1, cx2, cy2, x, y);  // 三次贝塞尔曲线
path.close();  // 闭合路径

canvas.drawPath(path, paint);
常用方法:
moveTo:移动画笔lineTo:画直线arcTo:画圆弧addRect:添加矩形addOval:添加椭圆
使用场景:
- 曲线图表
- 自定义形状
- 路径动画
3. 坐标系统转换
在绘制图表时,需要将数据坐标转换为画布坐标。
转换公式:
// 数据范围:minValue ~ maxValue
// 画布范围:0 ~ size.height

// Y轴转换(注意Y轴方向相反)
double dataToCanvasY(double value) {
  final range = maxValue - minValue;
  final ratio = (value - minValue) / range;
  return size.height - (ratio * size.height);
}

// X轴转换
double dataToCanvasX(int index, int total) {
  return (size.width / (total - 1)) * index;
}
注意事项:
- Canvas的Y轴向下为正
- 数据的Y轴向上为正
- 需要进行翻转转换
4. 计算属性的高级用法
计算属性可以根据对象状态动态返回值,减少数据冗余。
示例:
class TideData {
  String type;
  double height;
  String level;

  // 类型相关属性
  String get typeText => type == 'high' ? '高潮' : '低潮';
  Color get typeColor => type == 'high' ? Colors.blue : Colors.orange;
  IconData get typeIcon => type == 'high' ? Icons.arrow_upward : Icons.arrow_downward;

  // 等级相关属性
  String get levelText {
    switch (level) {
      case 'extreme_high': return '特大潮';
      case 'very_high': return '大潮';
      case 'high': return '中潮';
      case 'normal': return '平潮';
      case 'low': return '小潮';
      default: return '未知';
    }
  }

  Color get levelColor {
    switch (level) {
      case 'extreme_high': return Colors.red;
      case 'very_high': return Colors.deepOrange;
      case 'high': return Colors.orange;
      case 'normal': return Colors.blue;
      case 'low': return Colors.green;
      default: return Colors.grey;
    }
  }
}
优势:
- 减少存储空间
- 保持数据一致性
- 简化代码逻辑
- 便于维护和扩展
5. DateTime时间处理
Flutter中的DateTime类提供了丰富的时间处理功能。
基本用法:
// 获取当前时间
final now = DateTime.now();

// 创建指定时间
final date = DateTime(2024, 1, 22, 14, 30);

// 时间计算
final tomorrow = now.add(Duration(days: 1));
final yesterday = now.subtract(Duration(days: 1));

// 时间比较
if (date1.isAfter(date2)) { }
if (date1.isBefore(date2)) { }
if (date1.isAtSameMomentAs(date2)) { }

// 时间格式化
final hour = date.hour.toString().padLeft(2, '0');
final minute = date.minute.toString().padLeft(2, '0');
final timeString = '$hour:$minute';

// 星期几
final weekday = date.weekday;  // 1-7 (周一到周日)
常用属性:
year:年份month:月份(1-12)day:日期(1-31)hour:小时(0-23)minute:分钟(0-59)second:秒(0-59)weekday:星期(1-7)
使用场景:
- 潮汐时间计算
- 日期范围查询
- 时间格式化显示
6. List集合操作
Dart的List提供了丰富的集合操作方法。
常用方法:
// 生成列表
final list = List.generate(10, (index) => index * 2);

// 映射转换
final heights = tides.map((t) => t.height).toList();

// 筛选
final highTides = tides.where((t) => t.type == 'high').toList();

// 排序
tides.sort((a, b) => a.time.compareTo(b.time));

// 查找最大值
final maxHeight = heights.reduce((a, b) => a > b ? a : b);

// 查找最小值
final minHeight = heights.reduce((a, b) => a < b ? a : b);

// 求和
final total = heights.reduce((a, b) => a + b);

// 平均值
final average = total / heights.length;
链式操作:
final result = tides
    .where((t) => t.type == 'high')
    .map((t) => t.height)
    .reduce((a, b) => a > b ? a : b);
7. 数据可视化技巧
在潮汐曲线绘制中使用的可视化技巧。
网格线绘制:
// 绘制水平网格线
for (int i = 0; i <= 4; i++) {
  final y = (size.height / 4) * i;
  canvas.drawLine(
    Offset(0, y),
    Offset(size.width, y),
    gridPaint,
  );
}

// 绘制垂直网格线
for (int i = 0; i <= 4; i++) {
  final x = (size.width / 4) * i;
  canvas.drawLine(
    Offset(x, 0),
    Offset(x, size.height),
    gridPaint,
  );
}
数据点标记:
// 在曲线上标记数据点
for (int i = 0; i < tides.length; i++) {
  final x = calculateX(i);
  final y = calculateY(tides[i].height);

  // 绘制圆点
  canvas.drawCircle(
    Offset(x, y),
    6,
    Paint()..color = tides[i].typeColor,
  );

  // 绘制数值标签(可选)
  final textPainter = TextPainter(
    text: TextSpan(
      text: tides[i].height.toStringAsFixed(1),
      style: TextStyle(color: Colors.black, fontSize: 12),
    ),
    textDirection: TextDirection.ltr,
  );
  textPainter.layout();
  textPainter.paint(canvas, Offset(x - 10, y - 20));
}
颜色渐变:
final gradient = LinearGradient(
  colors: [Colors.blue, Colors.lightBlue],
  begin: Alignment.topCenter,
  end: Alignment.bottomCenter,
);

final paint = Paint()
  ..shader = gradient.createShader(
    Rect.fromLTWH(0, 0, size.width, size.height),
  );
8. 状态管理最佳实践
在潮汐查询应用中的状态管理。
状态变量:
CoastalCity? _selectedCity;           // 选中城市
List<DailyTide> _dailyTides = [];     // 潮汐数据
DateTime _selectedDate = DateTime.now();  // 选中日期
int _selectedDays = 7;                // 查询天数
状态更新:
void _updateCity(CoastalCity city) {
  setState(() {
    _selectedCity = city;
    _generateTideData();  // 重新生成数据
  });
}

void _updateDateRange(int days) {
  setState(() {
    _selectedDays = days;
    _generateTideData();  // 重新生成数据
  });
}
最佳实践:
- 只在setState中修改状态
- 避免在build方法中修改状态
- 合理拆分Widget减少重建范围
- 使用const构造函数优化性能
9. 数据模型设计
良好的数据模型设计是应用的基础。
模型层次:
CoastalCity (城市)
    └── DailyTide (每日潮汐)
            └── TideData (单次潮汐)
关系设计:
- 一个城市有多天的潮汐数据
- 每天有多次潮汐(通常4次)
- 每次潮汐包含时间、类型、潮高、等级
数据验证:
class TideData {
  final DateTime time;
  final String type;
  final double height;
  final String level;

  TideData({
    required this.time,
    required this.type,
    required this.height,
    required this.level,
  }) {
    // 验证类型
    assert(type == 'high' || type == 'low', 'Invalid tide type');

    // 验证潮高
    assert(height >= 0 && height <= 10, 'Invalid tide height');

    // 验证等级
    assert([
      'extreme_high',
      'very_high',
      'high',
      'normal',
      'low'
    ].contains(level), 'Invalid tide level');
  }
}
10. 性能优化技巧
提升应用性能的实用技巧。
ListView优化:
// 使用ListView.builder实现懒加载
ListView.builder(
  itemCount: _dailyTides.length,
  itemBuilder: (context, index) {
    return _buildDailyTideCard(_dailyTides[index]);
  },
)
const构造函数:
// 使用const减少重建
const Text('潮汐查询')
const Icon(Icons.waves)
const SizedBox(height: 16)
缓存计算结果:
class DailyTide {
  List<TideData> tides;

  // 缓存最大值
  double? _cachedMaxHeight;
  double get maxHeight {
    _cachedMaxHeight ??= tides
        .where((t) => t.type == 'high')
        .map((t) => t.height)
        .reduce((a, b) => a > b ? a : b);
    return _cachedMaxHeight!;
  }
}
避免不必要的重建:
// 将不变的Widget提取为独立组件
class StaticHeader extends StatelessWidget {
const StaticHeader({super.key});
Widget build(BuildContext context) {
return const Text('标题');
}
}
功能扩展方向
1. 实时潮汐数据
接入真实的潮汐数据API,提供准确的预测。
实现思路:
- 接入国家海洋局潮汐数据API
- 使用第三方潮汐预测服务
- 实时更新潮汐数据
- 缓存历史数据
API示例:
import 'package:http/http.dart' as http;

class TideApiService {
  static const String baseUrl = 'https://api.tide.example.com';

  Future<List<TideData>> fetchTideData(
    String cityCode,
    DateTime startDate,
    DateTime endDate,
  ) async {
    final response = await http.get(
      Uri.parse('$baseUrl/tide?city=$cityCode&start=$startDate&end=$endDate'),
    );

    if (response.statusCode == 200) {
      final data = jsonDecode(response.body);
      return (data['tides'] as List)
          .map((json) => TideData.fromJson(json))
          .toList();
    } else {
      throw Exception('Failed to load tide data');
    }
  }
}
2. 地图集成
在地图上显示沿海城市和潮汐站点。
实现思路:
- 集成高德地图或百度地图SDK
- 在地图上标注潮汐站点
- 点击站点显示潮汐信息
- 支持地图缩放和拖动
- 显示用户当前位置
代码示例:
AMapWidget(
  markers: _cities.map((city) => Marker(
    position: LatLng(city.latitude, city.longitude),
    icon: BitmapDescriptor.fromAssetImage('assets/tide_marker.png'),
    infoWindow: InfoWindow(
      title: city.name,
      snippet: '点击查看潮汐信息',
    ),
    onTap: () => _showCityTide(city),
  )).toSet(),
)
3. 潮汐预警
根据潮汐高度发送预警通知。
实现思路:
- 设置潮汐高度阈值
- 监测潮汐数据变化
- 发送推送通知
- 显示预警信息
- 支持自定义预警规则
预警类型:
- 特大潮预警:潮高>4.5m
- 大潮预警:潮高>4.0m
- 低潮预警:潮高<1.0m
代码示例:
import 'package:flutter_local_notifications/flutter_local_notifications.dart';

class TideAlertService {
  final FlutterLocalNotificationsPlugin _notifications =
      FlutterLocalNotificationsPlugin();

  Future<void> checkAndAlert(List<TideData> tides) async {
    for (var tide in tides) {
      if (tide.height > 4.5) {
        await _showNotification(
          '特大潮预警',
          '${tide.time.hour}:${tide.time.minute} 预计潮高${tide.height.toStringAsFixed(2)}m',
        );
      }
    }
  }

  Future<void> _showNotification(String title, String body) async {
    const androidDetails = AndroidNotificationDetails(
      'tide_alert',
      '潮汐预警',
      importance: Importance.high,
      priority: Priority.high,
    );
    const details = NotificationDetails(android: androidDetails);
    await _notifications.show(0, title, body, details);
  }
}
4. 钓鱼时机推荐
根据潮汐数据推荐最佳钓鱼时间。
实现思路:
- 分析潮汐变化规律
- 计算最佳钓鱼时段
- 考虑月相影响
- 提供钓鱼建议
- 显示鱼类活跃度
钓鱼规律:
- 涨潮前后1-2小时:鱼类活跃
- 落潮前后1-2小时:鱼类活跃
- 大潮期间:鱼类更活跃
- 新月和满月:最佳钓鱼时机
代码示例:
class FishingRecommendation {
  static List<FishingTime> getBestTimes(DailyTide dailyTide) {
    final recommendations = <FishingTime>[];

    for (var tide in dailyTide.tides) {
      // 涨潮前1小时到涨潮后1小时
      if (tide.type == 'high') {
        recommendations.add(FishingTime(
          start: tide.time.subtract(Duration(hours: 1)),
          end: tide.time.add(Duration(hours: 1)),
          quality: 'excellent',
          reason: '涨潮期,鱼类活跃',
        ));
      }

      // 落潮前1小时到落潮后1小时
      if (tide.type == 'low') {
        recommendations.add(FishingTime(
          start: tide.time.subtract(Duration(hours: 1)),
          end: tide.time.add(Duration(hours: 1)),
          quality: 'good',
          reason: '落潮期,鱼类觅食',
        ));
      }
    }

    return recommendations;
  }
}
5. 历史数据对比
对比不同日期的潮汐数据,分析变化趋势。
实现思路:
- 保存历史潮汐数据
- 选择对比日期
- 绘制对比曲线
- 显示差异分析
- 导出对比报告
代码示例:
class TideComparisonPage extends StatelessWidget {
  final DailyTide tide1;
  final DailyTide tide2;

  Widget build(BuildContext context) {
    return Column(
      children: [
        Text('${tide1.dateText} vs ${tide2.dateText}'),
        CustomPaint(
          painter: ComparisonChartPainter(tide1.tides, tide2.tides),
        ),
        _buildComparisonTable(),
      ],
    );
  }

  Widget _buildComparisonTable() {
    return Table(
      children: [
        TableRow(children: [
          Text('日期'),
          Text(tide1.dateText),
          Text(tide2.dateText),
        ]),
        TableRow(children: [
          Text('最高潮位'),
          Text('${tide1.maxHeight.toStringAsFixed(2)}m'),
          Text('${tide2.maxHeight.toStringAsFixed(2)}m'),
        ]),
        TableRow(children: [
          Text('最低潮位'),
          Text('${tide1.minHeight.toStringAsFixed(2)}m'),
          Text('${tide2.minHeight.toStringAsFixed(2)}m'),
        ]),
      ],
    );
  }
}
6. 潮汐日历
以日历形式展示整月的潮汐信息。
实现思路:
- 使用table_calendar插件
- 在日历上标注潮汐等级
- 点击日期查看详情
- 显示月相变化
- 标注大潮小潮日期
代码示例:
import 'package:table_calendar/table_calendar.dart';
class TideCalendarPage extends StatefulWidget {
State<TideCalendarPage> createState() => _TideCalendarPageState();
}
class _TideCalendarPageState extends State<TideCalendarPage> {
DateTime _selectedDay = DateTime.now();
Map<DateTime, DailyTide> _tideMap = {};
Widget build(BuildContext context) {
return TableCalendar(
firstDay: DateTime.now(),
lastDay: DateTime.now().add(Duration(days: 90)),
focusedDay: _selectedDay,
selectedDayPredicate: (day) => isSameDay(_selectedDay, day),
onDaySelected: (selectedDay, focusedDay) {
setState(() {
_selectedDay = selectedDay;
});
_showTideDetail(_tideMap[selectedDay]);
},
calendarBuilders: CalendarBuilders(
markerBuilder: (context, date, events) {
final tide = _tideMap[date];
if (tide != null) {
return Container(
width: 8,
height: 8,
decoration: BoxDecoration(
color: _getTideColor(tide.maxHeight),
shape: BoxShape.circle,
),
);
}
return null;
},
),
);
}
Color _getTideColor(double height) {
if (height > 4.5) return Colors.red;
if (height > 4.0) return Colors.orange;
if (height > 3.0) return Colors.blue;
return Colors.green;
}
}
7. 潮汐统计
统计分析潮汐数据,生成报表。
实现思路:
- 统计月度潮汐数据
- 计算平均潮高
- 分析潮汐规律
- 生成图表报告
- 导出PDF报告
统计指标:
- 月平均最高潮位
- 月平均最低潮位
- 大潮天数
- 小潮天数
- 潮差变化趋势
8. 离线功能
支持离线查看已缓存的潮汐数据。
实现思路:
- 缓存潮汐数据到本地
- 检测网络状态
- 离线模式提示
- 数据过期提醒
- 网络恢复后自动更新
代码示例:
import 'package:connectivity_plus/connectivity_plus.dart';

class OfflineTideService {
  Future<bool> isOnline() async {
    final result = await Connectivity().checkConnectivity();
    return result != ConnectivityResult.none;
  }

  Future<void> cacheTideData(List<DailyTide> tides) async {
    final prefs = await SharedPreferences.getInstance();
    final jsonData = tides.map((t) => t.toJson()).toList();
    await prefs.setString('cached_tides', jsonEncode(jsonData));
  }

  Future<List<DailyTide>> loadCachedTides() async {
    final prefs = await SharedPreferences.getInstance();
    final jsonString = prefs.getString('cached_tides');
    if (jsonString == null) return [];

    final jsonData = jsonDecode(jsonString) as List;
    return jsonData.map((json) => DailyTide.fromJson(json)).toList();
  }
}
常见问题解答
1. 如何获取真实的潮汐数据?
问题:模拟数据不够准确,如何获取真实潮汐数据?
解答:
可以接入专业的潮汐数据API:
import 'package:http/http.dart' as http;
import 'dart:convert';

class TideApiService {
  // 使用国家海洋局API(示例)
  static const String apiUrl = 'https://api.ocean.gov.cn/tide';
  static const String apiKey = 'YOUR_API_KEY';

  Future<List<TideData>> fetchRealTideData({
    required String cityCode,
    required DateTime date,
  }) async {
    try {
      final response = await http.get(
        Uri.parse('$apiUrl/query')
            .replace(queryParameters: {
          'city': cityCode,
          'date': date.toIso8601String(),
          'key': apiKey,
        }),
      );

      if (response.statusCode == 200) {
        final data = jsonDecode(response.body);
        return _parseTideData(data);
      } else {
        throw Exception('API请求失败: ${response.statusCode}');
      }
    } catch (e) {
      print('获取潮汐数据失败: $e');
      return [];
    }
  }

  List<TideData> _parseTideData(Map<String, dynamic> data) {
    final tides = <TideData>[];
    for (var item in data['tides']) {
      tides.add(TideData(
        time: DateTime.parse(item['time']),
        type: item['type'],
        height: (item['height'] as num).toDouble(),
        level: item['level'],
      ));
    }
    return tides;
  }
}
可用的潮汐数据源:
- 国家海洋局潮汐预报
- NOAA潮汐数据(美国)
- 各地海洋气象台
- 商业潮汐数据服务
2. 如何计算潮汐预测?
问题:如何自己计算潮汐预测而不依赖API?
解答:
潮汐预测基于天文算法,主要考虑月球和太阳的引潮力:
class TideCalculator {
  // 简化的潮汐计算(实际算法更复杂)
  static double calculateTideHeight({
    required DateTime time,
    required double latitude,
    required double longitude,
  }) {
    // 1. 计算月球位置
    final moonPhase = _calculateMoonPhase(time);

    // 2. 计算太阳位置
    final sunPosition = _calculateSunPosition(time);

    // 3. 计算引潮力
    final lunarForce = _calculateLunarForce(moonPhase, latitude);
    final solarForce = _calculateSolarForce(sunPosition, latitude);

    // 4. 合成潮汐高度
    final baseHeight = 2.5;  // 基准潮高
    final tideHeight = baseHeight + lunarForce + solarForce;

    return tideHeight;
  }

  static double _calculateMoonPhase(DateTime time) {
    // 月相周期约29.53天
    final daysSinceNewMoon = time.difference(DateTime(2000, 1, 6)).inDays % 29.53;
    return daysSinceNewMoon / 29.53 * 2 * pi;
  }

  static double _calculateLunarForce(double moonPhase, double latitude) {
    // 月球引潮力(简化)
    return 1.5 * cos(moonPhase) * cos(latitude * pi / 180);
  }

  static double _calculateSunPosition(DateTime time) {
    // 太阳位置(简化)
    final dayOfYear = time.difference(DateTime(time.year, 1, 1)).inDays;
    return dayOfYear / 365.25 * 2 * pi;
  }

  static double _calculateSolarForce(double sunPosition, double latitude) {
    // 太阳引潮力(简化)
    return 0.5 * cos(sunPosition) * cos(latitude * pi / 180);
  }
}
注意:
- 实际潮汐计算非常复杂
- 需要考虑地形、海底地形等因素
- 建议使用专业的潮汐预测库
- 或接入专业的潮汐数据API
3. 如何优化潮汐曲线的绘制性能?
问题:当数据点很多时,曲线绘制卡顿怎么办?
解答:
可以采用以下优化策略:
class OptimizedTideChartPainter extends CustomPainter {
final List<TideData> tides;
Path? _cachedPath; // 缓存路径
OptimizedTideChartPainter(this.tides);
void paint(Canvas canvas, Size size) {
// 1. 使用缓存路径
if (_cachedPath == null) {
_cachedPath = _createPath(size);
}
// 2. 使用抗锯齿
final paint = Paint()
..style = PaintingStyle.stroke
..strokeWidth = 2
..isAntiAlias = true
..color = Colors.blue;
canvas.drawPath(_cachedPath!, paint);
// 3. 只绘制可见区域的点
_drawVisiblePoints(canvas, size);
}
Path _createPath(Size size) {
final path = Path();
// 数据点采样(如果点太多)
final sampledTides = _sampleData(tides, 50);
for (int i = 0; i < sampledTides.length; i++) {
final x = _calculateX(i, sampledTides.length, size.width);
final y = _calculateY(sampledTides[i].height, size.height);
if (i == 0) {
path.moveTo(x, y);
} else {
path.lineTo(x, y);
}
}
return path;
}
List<TideData> _sampleData(List<TideData> data, int maxPoints) {
if (data.length <= maxPoints) return data;
final step = data.length / maxPoints;
final sampled = <TideData>[];
for (int i = 0; i < maxPoints; i++) {
sampled.add(data[(i * step).floor()]);
}
return sampled;
}
void _drawVisiblePoints(Canvas canvas, Size size) {
// 只绘制关键点(高潮和低潮)
for (var tide in tides) {
final x = _calculateX(tides.indexOf(tide), tides.length, size.width);
final y = _calculateY(tide.height, size.height);
canvas.drawCircle(
Offset(x, y),
4,
Paint()..color = tide.typeColor,
);
}
}
bool shouldRepaint(OptimizedTideChartPainter oldDelegate) {
return tides != oldDelegate.tides;
}
double _calculateX(int index, int total, double width) {
return (width / (total - 1)) * index;
}
double _calculateY(double height, double canvasHeight) {
final maxHeight = tides.map((t) => t.height).reduce((a, b) => a > b ? a : b);
final minHeight = tides.map((t) => t.height).reduce((a, b) => a < b ? a : b);
final range = maxHeight - minHeight;
return canvasHeight - ((height - minHeight) / range) * canvasHeight;
}
}
优化技巧:
- 缓存绘制路径
- 数据点采样
- 只绘制可见区域
- 使用shouldRepaint优化重绘
- 启用抗锯齿
4. 如何实现潮汐动画效果?
问题:想让潮汐曲线有动画效果,如何实现?
解答:
使用AnimationController实现动画:
class AnimatedTideChart extends StatefulWidget {
final List<TideData> tides;
const AnimatedTideChart({super.key, required this.tides});
State<AnimatedTideChart> createState() => _AnimatedTideChartState();
}
class _AnimatedTideChartState extends State<AnimatedTideChart>
with SingleTickerProviderStateMixin {
late AnimationController _controller;
late Animation<double> _animation;
void initState() {
super.initState();
_controller = AnimationController(
duration: const Duration(seconds: 2),
vsync: this,
);
_animation = Tween<double>(begin: 0, end: 1).animate(
CurvedAnimation(parent: _controller, curve: Curves.easeInOut),
);
_controller.forward();
}
void dispose() {
_controller.dispose();
super.dispose();
}
Widget build(BuildContext context) {
return AnimatedBuilder(
animation: _animation,
builder: (context, child) {
return CustomPaint(
painter: AnimatedTideChartPainter(
widget.tides,
_animation.value,
),
);
},
);
}
}
class AnimatedTideChartPainter extends CustomPainter {
final List<TideData> tides;
final double progress;
AnimatedTideChartPainter(this.tides, this.progress);
void paint(Canvas canvas, Size size) {
final paint = Paint()
..style = PaintingStyle.stroke
..strokeWidth = 3
..color = Colors.blue;
final path = Path();
final visiblePoints = (tides.length * progress).floor();
for (int i = 0; i < visiblePoints; i++) {
final x = (size.width / (tides.length - 1)) * i;
final y = _calculateY(tides[i].height, size.height);
if (i == 0) {
path.moveTo(x, y);
} else {
path.lineTo(x, y);
}
}
canvas.drawPath(path, paint);
}
double _calculateY(double height, double canvasHeight) {
final maxHeight = tides.map((t) => t.height).reduce((a, b) => a > b ? a : b);
final minHeight = tides.map((t) => t.height).reduce((a, b) => a < b ? a : b);
final range = maxHeight - minHeight;
return canvasHeight - ((height - minHeight) / range) * canvasHeight;
}
bool shouldRepaint(AnimatedTideChartPainter oldDelegate) {
return progress != oldDelegate.progress;
}
}
动画效果:
- 曲线逐渐绘制
- 数据点依次出现
- 平滑的过渡效果
5. 如何导出潮汐数据?
问题:如何将潮汐数据导出为PDF或Excel?
解答:
使用pdf和excel插件导出数据:
import 'package:pdf/pdf.dart';
import 'package:pdf/widgets.dart' as pw;
import 'package:excel/excel.dart';

class TideExportService {
  // 导出为PDF
  Future<void> exportToPdf(List<DailyTide> tides, String cityName) async {
    final pdf = pw.Document();

    pdf.addPage(
      pw.Page(
        build: (context) => pw.Column(
          crossAxisAlignment: pw.CrossAxisAlignment.start,
          children: [
            pw.Text(
              '$cityName 潮汐预报',
              style: pw.TextStyle(fontSize: 24, fontWeight: pw.FontWeight.bold),
            ),
            pw.SizedBox(height: 20),
            ...tides.map((dailyTide) => _buildPdfDaySection(dailyTide)),
          ],
        ),
      ),
    );

    final output = await getApplicationDocumentsDirectory();
    final file = File('${output.path}/tide_report.pdf');
    await file.writeAsBytes(await pdf.save());
  }

  pw.Widget _buildPdfDaySection(DailyTide dailyTide) {
    return pw.Column(
      crossAxisAlignment: pw.CrossAxisAlignment.start,
      children: [
        pw.Text(
          dailyTide.dateText,
          style: pw.TextStyle(fontSize: 18, fontWeight: pw.FontWeight.bold),
        ),
        pw.SizedBox(height: 10),
        pw.Table(
          border: pw.TableBorder.all(),
          children: [
            pw.TableRow(children: [
              pw.Text('时间'),
              pw.Text('类型'),
              pw.Text('潮高'),
              pw.Text('等级'),
            ]),
            ...dailyTide.tides.map((tide) => pw.TableRow(children: [
              pw.Text('${tide.time.hour}:${tide.time.minute}'),
              pw.Text(tide.typeText),
              pw.Text('${tide.height.toStringAsFixed(2)}m'),
              pw.Text(tide.levelText),
            ])),
          ],
        ),
        pw.SizedBox(height: 20),
      ],
    );
  }

  // 导出为Excel
  Future<void> exportToExcel(List<DailyTide> tides, String cityName) async {
    final excel = Excel.createExcel();
    final sheet = excel['潮汐数据'];

    // 表头
    sheet.appendRow([
      '日期',
      '时间',
      '类型',
      '潮高(m)',
      '等级',
      '月相',
    ]);

    // 数据行
    for (var dailyTide in tides) {
      for (var tide in dailyTide.tides) {
        sheet.appendRow([
          dailyTide.dateText,
          '${tide.time.hour}:${tide.time.minute}',
          tide.typeText,
          tide.height.toStringAsFixed(2),
          tide.levelText,
          dailyTide.moonPhaseText,
        ]);
      }
    }

    final output = await getApplicationDocumentsDirectory();
    final file = File('${output.path}/tide_data.xlsx');
    await file.writeAsBytes(excel.encode()!);
  }
}
导出格式:
- PDF:适合打印和分享
- Excel:适合数据分析
- CSV:通用格式
- JSON:程序间交换
项目总结
核心功能流程
数据流转
技术架构
项目特色
- 多城市支持:覆盖10个沿海城市,数据独立管理
- 精确预测:精确到分钟的潮汐时间预测
- 可视化展示:自定义Canvas绘制潮汐曲线
- 月相关联:显示月相对潮汐的影响
- 等级分类:5个等级清晰标识潮汐大小
- 知识科普:集成潮汐相关知识介绍
- 用户体验:Material Design 3设计,交互流畅
- 数据详实:提供潮高、潮差等详细数据
学习收获
通过本项目,你将掌握:
- Flutter基础:Widget组合、状态管理、导航路由
- 自定义绘制:CustomPainter、Canvas、Path使用
- 数据可视化:图表绘制、坐标转换、曲线平滑
- 时间处理:DateTime操作、时间计算、格式化
- 数学计算:三角函数、坐标映射、数据插值
- UI设计:卡片布局、颜色搭配、视觉层次
- 代码组织:模型设计、方法封装、代码复用
性能优化建议
- 列表优化:使用ListView.builder实现懒加载
- 绘制优化:缓存Path、数据采样、shouldRepaint
- 状态管理:合理使用setState,避免不必要的重建
- 数据缓存:缓存计算结果,避免重复计算
- 异步操作:使用Future和async/await处理耗时操作
- 内存管理:及时释放不用的资源和监听器
后续优化方向
- 真实数据:接入潮汐数据API,获取准确预测
- 地图显示:集成地图SDK,可视化潮汐站点
- 预警功能:根据潮汐高度发送预警通知
- 钓鱼推荐:根据潮汐推荐最佳钓鱼时间
- 历史对比:对比不同日期的潮汐数据
- 潮汐日历:以日历形式展示整月潮汐
- 数据统计:统计分析潮汐规律
- 离线功能:支持离线查看缓存数据
本项目提供了一个完整的潮汐查询应用框架,你可以在此基础上继续扩展功能,打造更加专业的海洋气象应用。
欢迎加入开源鸿蒙跨平台社区:https://openharmonycrossplatform.csdn.net
讨论HarmonyOS开发技术,专注于API与组件、DevEco Studio、测试、元服务和应用上架分发等。
更多推荐


 15
15 0
0- 0


 已为社区贡献29条内容

所有评论(0)