鸿蒙图表MarkerView遮挡解决方案
·
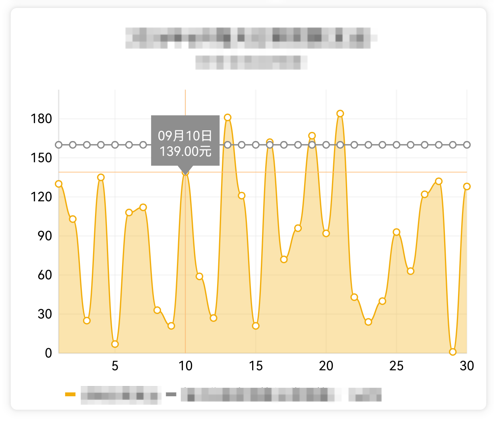
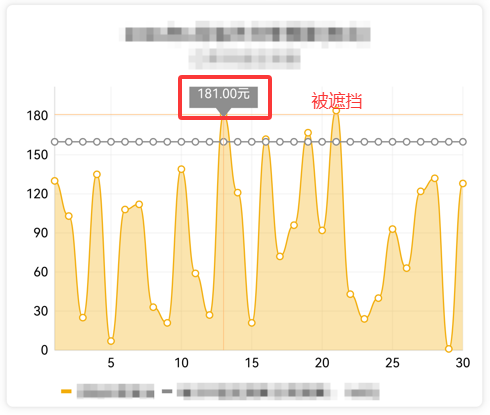
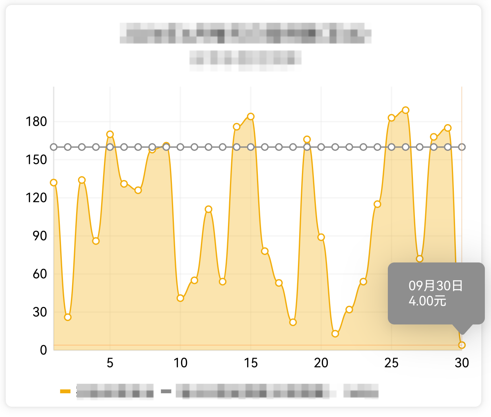
鸿蒙项目接入了@ohos/mpchart图表框架,在实现MarkerView时出现了MarkerView被遮挡问题,体验感不佳,查找官方文档没有一个有效的设置方式,以下是被遮挡截图
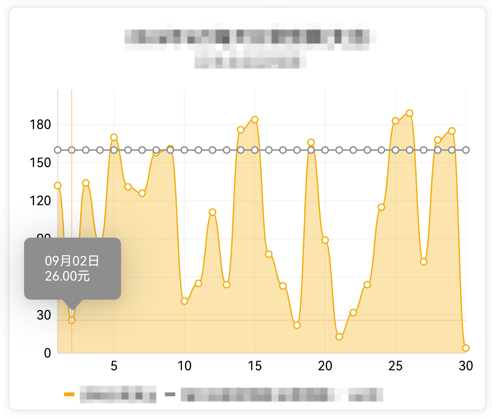
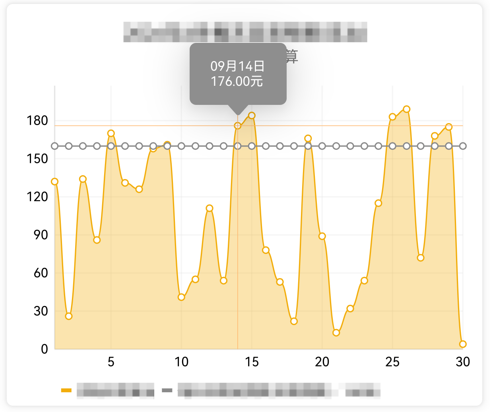
解决方案使用ArkTS中的Stack包裹图表控件,在包裹一个Stack组件用于Popup来实现气泡效果
Stack
    |--- LineChart
    |--- Stack().bindPopup用于实现MarkerView效果
前置依赖准备
- 先通过鸿蒙ohpm命令安装
@ohos/mpchart三方库,确保版本为最新版,我这里用的是V3.0.30,该版本已适配HarmonyOS NEXT的API接口规范。 - 导入所需核心类:
AxisDependency、EntryOhos、LineChart、LineChartModel、OnChartValueSelectedListener等图表相关API
ohpm i @ohos/mpchart
状态变量定义
通过OnChartValueSelectedListener回调,在用户点击/长按图表数据点时,同步获取数据信息和屏幕像素坐标
@Entry
@ComponentV2
struct LineChartDemo {
  // 线形图配置构建类
  @Local lineChartModel: LineChartModel | undefined = undefined;
  // Popup气泡位置
  @Local positionX: number = 0;
  @Local positionY: number = 0;
  // 选中点的Popup气泡文字描述
  @Local popupMessage: string = '';
  // 气泡显示控制变量
  @Local showUI: boolean = false;
  @Local handlePopup: boolean = false;
  // 图表数据选择监听事件
  private valueSelectedListener: OnChartValueSelectedListener = {
    onValueSelected: (e: EntryOhos, h: Highlight) => {
      // 触发气泡显示
      this.showUI = true;
      // 格式化获取选中点的Popup气泡文字描述
      this.popupMessage = `${e.getData()?.toString()}\n${e.getY().toFixed(2)}元`;
      // 转换数据点为屏幕像素坐标
      this.positionX = this.lineChartModel?.getTransformer(AxisDependency.LEFT)?.getPixelForValues(e.getX(), e.getY()).x ?? 0;
      this.positionY = this.lineChartModel?.getTransformer(AxisDependency.LEFT)?.getPixelForValues(e.getX(), e.getY()).y ?? 0;
      this.handlePopup = true;
    },
    onNothingSelected: () => {
      // 取消选中时隐藏气泡
      this.showUI = false;
      this.handlePopup = false;
      this.popupMessage = '';
    }
  }
}
图表基础初始化
在aboutToAppear生命周期中完成图表数据和基础样式配置
aboutToAppear(): void {
    this.lineChartModel = new LineChartModel();
    this.lineChartModel.setOnChartValueSelectedListener(this.valueSelectedListener);
    this.lineChartModel.setHitTestMode(HitTestMode.Block);
    this.lineChartModel.setExtraOffsets(10, 10, 10, 10);
    this.lineChartModel.setNoDataText('没有可查看数据');
    //不显示图表描述信息
    this.lineChartModel.getDescription()?.setEnabled(false);
    //不支持图表缩放
    this.lineChartModel.setScaleEnabled(false);
    this.lineChartModel.animateXY(500, 500);
    // 改变y标签的位置
    let leftAxis = this.lineChartModel.getAxisLeft();
    if (leftAxis) {
      leftAxis.setAxisMinimum(0);
      const color = ColorUtil.parseColor('#e5e5e5');
      leftAxis.setAxisLineColor(color);
      leftAxis.setGridColor(color);
      leftAxis.setValueFormatter(new leftAxisValueFormatter());
    }
    //右y轴不显示
    this.lineChartModel.getAxisRight()?.setEnabled(false);
    //x坐标轴
    let xAxis = this.lineChartModel.getXAxis();
    if (xAxis) {
      const color = ColorUtil.parseColor('#e5e5e5');
      xAxis.setPosition(XAxisPosition.BOTTOM);
      xAxis.setAxisLineColor(color);
      xAxis.setGridColor(color);
    }
    //获取图表的图例
    let legend = this.lineChartModel.getLegend();
    if (legend) {
      legend.setForm(LegendForm.LINE);
      // 图例换行
      legend.setWordWrapEnabled(true);
      //图例设置在下方
      legend.setVerticalAlignment(LegendVerticalAlignment.BOTTOM);
      legend.setDrawInside(false);
      legend.setFormSize(8);
      legend.setFormToTextSpace(4);
      legend.setXEntrySpace(6);
    }
    const days = 30;
    // 测试数据
    let dataSetList = new JArrayList<ILineDataSet>();
    let entryList = new JArrayList<EntryOhos>();
    for (let day = 1; day < (days + 1); day++) {
      const date = `9月${day}日`;
      const entry = new EntryOhos(day, Math.floor(Math.random() * 200), undefined, date);
      everyDayEntryList.add(entry);
    }
    let label = `标签`;
    let lineDataSet = new LineDataSet(entryList, label);
    lineDataSet.setMode(LineDataSetMode.HORIZONTAL_BEZIER);
    lineDataSet.setCubicIntensity(0.2);
    lineDataSet.setDrawFilled(true);
    lineDataSet.setDrawCircles(true);
    lineDataSet.setLineWidth(1);
    lineDataSet.setCircleRadius(3);
    lineDataSet.setCircleHoleRadius(2);
    lineDataSet.setHighlightEnabled(true);
    lineDataSet.setCircleColor(ColorUtil.parseColor('#f2ad0b'));
    lineDataSet.setCircleHoleColor(Color.White);
    lineDataSet.setColorByColor(ColorUtil.parseColor('#f2ad0b'));
    lineDataSet.setFillColor(ColorUtil.parseColor('#3bf2ad0b'));
    dataSetList.add(lineDataSet);

    let lineData = new LineData(dataSetList);
    lineData.setDrawValues(false);
    this.lineChartModel.setData(lineData);
    this.lineChartModel.invalidate();
}
气泡绑定实现
在build方法中通过bindPopup方法将气泡与选中点位置绑定,实现跟随数据点展示的效果
build() {
  Column() {
    Stack() {
      LineChart({ model: this.lineChartModel })
        .width('100%')
        .height('100%')
      if (this.showUI) {
        // 占位元素用于锚定Popup气泡位置
        Stack()
          .width(1)
          .height(1)
          .position({ x: this.positionX, y: this.positionY })
          .bindPopup(this.handlePopup, {
            message: this.popupMessage,
            messageOptions: {
              font: { size: 10 },
              textColor: '#FFFFFF'
            },
            radius: 5,
            placementOnTop: true,
            popupColor: '#8E8E8E',
            backgroundBlurStyle: BlurStyle.NONE,
            onStateChange: (e) => {
              // 气泡关闭时同步取消图表选中状态
              if (!e.isVisible) {
                this.handlePopup = false;
                this.lineChartModel?.highlightValueForObject(null);
              }
            }
          });
      }
    }
    .width('100%')
    .height('311')
  }.padding(15)
   .width('100%')
   .height('100%')
}
自定义样式扩展
可以通过修改Popup配置项实现更多自定义效果:
- 调整
placement参数控制气泡在数据点的上下方位 - 自定义气泡的背景色、文字大小、圆角等样式

讨论HarmonyOS开发技术,专注于API与组件、DevEco Studio、测试、元服务和应用上架分发等。
更多推荐

 0
0 0
0- 0


 已为社区贡献1条内容

所有评论(0)