Harmonyos应用实例96:折线统计图生成器
·
应用实例六:折线统计图生成器
知识点:认识单式折线统计图,能根据数据绘制折线统计图并进行简单分析。
功能:学生输入一组数据(如某地一周的气温),应用自动生成折线统计图。支持设置图表标题、坐标轴标签。生成后,学生可以点击图上的点查看具体数值,并尝试分析数据的变化趋势。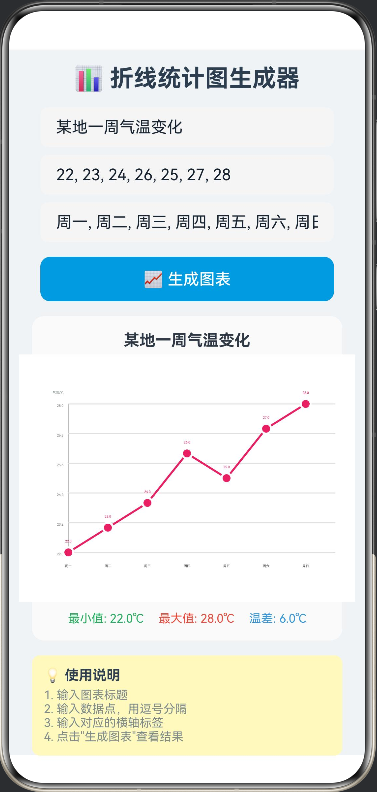
// LineChartGenerator.ets

interface PointData {
  x: number
  y: number
}

interface LineData {
  x1: number
  y1: number
  x2: number
  y2: number
}

@Entry
@Component
struct LineChartGenerator {
  private settings: RenderingContextSettings = new RenderingContextSettings(true);
  private context: CanvasRenderingContext2D = new CanvasRenderingContext2D(this.settings);

  @State dataPoints: string = "22, 23, 24, 26, 25, 27, 28";
  @State chartTitle: string = "某地一周气温变化";
  @State yAxisLabel: string = "气温/℃";
  @State xAxisLabels: string = "周一, 周二, 周三, 周四, 周五, 周六, 周日";
  @State points: PointData[] = [];
  @State lines: LineData[] = [];
  @State maxValue: number = 0;
  @State minValue: number = 0;
  @State labels: string[] = [];

  build() {
    Column({ space: 15 }) {
      Text('📊 折线统计图生成器')
        .fontSize(24)
        .fontWeight(FontWeight.Bold)
        .fontColor('#2C3E50')

      Column({ space: 8 }) {
        TextInput({ text: this.chartTitle, placeholder: '图表标题' })
          .width('90%')
          .height(40)
          .backgroundColor('#F5F5F5')
          .borderRadius(8)
          .onChange((v: string) => this.chartTitle = v)

        TextInput({ text: this.dataPoints, placeholder: '数据点,用逗号分隔(如:22, 23, 24, 26, 25, 27, 28)' })
          .width('90%')
          .height(40)
          .backgroundColor('#F5F5F5')
          .borderRadius(8)
          .onChange((v: string) => this.dataPoints = v)

        TextInput({ text: this.xAxisLabels, placeholder: '横轴标签,用逗号分隔' })
          .width('90%')
          .height(40)
          .backgroundColor('#F5F5F5')
          .borderRadius(8)
          .onChange((v: string) => this.xAxisLabels = v)
      }

      Button('📈 生成图表')
        .width('90%')
        .height(45)
        .backgroundColor('#3498DB')
        .borderRadius(10)
        .fontSize(16)
        .onClick(() => this.generateChart())

      if (this.points.length > 0) {
        Column() {
          Text(this.chartTitle)
            .fontSize(16)
            .fontWeight(FontWeight.Bold)
            .margin({ bottom: 5 })

          Canvas(this.context)
            .width(340)
            .height(250)
            .backgroundColor('#FFFFFF')
            .borderRadius(10)
            .shadow({ radius: 5, color: '#00000010' })
            .onReady(() => {
              this.drawChart();
            })

          Row({ space: 15 }) {
            Text(`最小值: ${this.minValue.toFixed(1)}℃`)
              .fontSize(12)
              .fontColor('#27AE60')
            Text(`最大值: ${this.maxValue.toFixed(1)}℃`)
              .fontSize(12)
              .fontColor('#E74C3C')
            Text(`温差: ${(this.maxValue - this.minValue).toFixed(1)}℃`)
              .fontSize(12)
              .fontColor('#3498DB')
          }
          .margin({ top: 10 })
        }
        .width('95%')
        .padding(15)
        .backgroundColor('#FAFAFA')
        .borderRadius(12)
      }

      Column() {
        Text('💡 使用说明')
          .fontSize(14)
          .fontWeight(FontWeight.Bold)
          .fontColor('#2C3E50')

        Text('1. 输入图表标题')
          .fontSize(12)
          .fontColor('#7F8C8D')
          .margin({ top: 5 })

        Text('2. 输入数据点,用逗号分隔')
          .fontSize(12)
          .fontColor('#7F8C8D')

        Text('3. 输入对应的横轴标签')
          .fontSize(12)
          .fontColor('#7F8C8D')

        Text('4. 点击"生成图表"查看结果')
          .fontSize(12)
          .fontColor('#7F8C8D')
      }
      .width('95%')
      .padding(12)
      .backgroundColor('#FFF9C4')
      .borderRadius(8)
      .alignItems(HorizontalAlign.Start)
    }
    .width('100%')
    .height('100%')
    .backgroundColor('#F0F3F6')
    .padding(15)
  }

  private generateChart(): void {
    const values: number[] = [];
    const valueStrs = this.dataPoints.split(',');
    for (let i = 0; i < valueStrs.length; i++) {
      const val = parseFloat(valueStrs[i].trim());
      if (!isNaN(val)) {
        values.push(val);
      }
    }

    this.labels = this.xAxisLabels.split(',').map((s: string) => s.trim());

    if (values.length === 0) {
      return;
    }

    this.maxValue = Math.max(...values);
    this.minValue = Math.min(...values);
    const range = this.maxValue - this.minValue;

    this.points = [];
    this.lines = [];

    const padding = 50;
    const chartWidth = 340 - padding * 2;
    const chartHeight = 200 - padding;
    const xStep = values.length > 1 ? chartWidth / (values.length - 1) : 0;

    for (let i = 0; i < values.length; i++) {
      const x = padding + i * xStep;
      const y = padding + chartHeight - ((values[i] - this.minValue) / (range || 1)) * chartHeight;
      this.points.push({ x: x, y: y });

      if (i > 0) {
        const prevPoint = this.points[i - 1];
        this.lines.push({
          x1: prevPoint.x,
          y1: prevPoint.y,
          x2: x,
          y2: y
        });
      }
    }

    this.drawChart();
  }

  private drawChart(): void {
    const ctx = this.context;
    const w = 340;
    const h = 250;

    ctx.clearRect(0, 0, w, h);
    ctx.fillStyle = '#FFFFFF';
    ctx.fillRect(0, 0, w, h);

    const padding = 50;
    const chartHeight = 200 - padding;

    ctx.strokeStyle = '#BDBDBD';
    ctx.lineWidth = 1;
    ctx.beginPath();
    ctx.moveTo(padding, padding);
    ctx.lineTo(padding, padding + chartHeight);
    ctx.lineTo(w - 20, padding + chartHeight);
    ctx.stroke();

    ctx.fillStyle = '#7F8C8D';
    ctx.font = '10px sans-serif';
    ctx.textAlign = 'right';
    ctx.fillText(this.yAxisLabel, padding - 5, padding - 10);

    if (this.points.length === 0) {
      ctx.fillStyle = '#BDBDBD';
      ctx.font = '14px sans-serif';
      ctx.textAlign = 'center';
      ctx.fillText('请输入数据并点击"生成图表"', w / 2, h / 2);
      return;
    }

    const range = this.maxValue - this.minValue;
    const gridLines = 5;
    ctx.fillStyle = '#9E9E9E';
    ctx.font = '10px sans-serif';
    ctx.textAlign = 'right';

    for (let i = 0; i <= gridLines; i++) {
      const y = padding + (chartHeight / gridLines) * i;
      const value = this.maxValue - (range / gridLines) * i;

      ctx.strokeStyle = '#E0E0E0';
      ctx.lineWidth = 1;
      ctx.beginPath();
      ctx.moveTo(padding, y);
      ctx.lineTo(w - 20, y);
      ctx.stroke();

      ctx.fillStyle = '#757575';
      ctx.fillText(value.toFixed(1), padding - 5, y + 3);
    }

    ctx.strokeStyle = '#E91E63';
    ctx.lineWidth = 2;
    ctx.beginPath();
    for (let i = 0; i < this.lines.length; i++) {
      const line = this.lines[i];
      if (i === 0) {
        ctx.moveTo(line.x1, line.y1);
      }
      ctx.lineTo(line.x2, line.y2);
    }
    ctx.stroke();

    ctx.fillStyle = '#E91E63';
    for (let i = 0; i < this.points.length; i++) {
      const point = this.points[i];
      ctx.beginPath();
      ctx.arc(point.x, point.y, 5, 0, Math.PI * 2);
      ctx.fill();

      ctx.strokeStyle = '#FFFFFF';
      ctx.lineWidth = 2;
      ctx.stroke();
    }

    ctx.fillStyle = '#424242';
    ctx.font = '10px sans-serif';
    ctx.textAlign = 'center';
    for (let i = 0; i < this.points.length; i++) {
      const point = this.points[i];
      const label = this.labels[i] || `${i + 1}`;
      ctx.fillText(label, point.x, padding + chartHeight + 15);

      const value = (this.minValue + (this.maxValue - this.minValue) * (1 - (point.y - padding) / chartHeight)).toFixed(1);
      ctx.fillStyle = '#E91E63';
      ctx.fillText(value, point.x, point.y - 10);
      ctx.fillStyle = '#424242';
    }
  }
}

讨论HarmonyOS开发技术,专注于API与组件、DevEco Studio、测试、元服务和应用上架分发等。
更多推荐


 0
0 0
0- 0


 已为社区贡献400条内容

所有评论(0)