HarmonyOS图表组件深度实战(三):雷达图与散点图的极坐标多边形与回归分析
文章目录

每日一句正能量
“这世上所有的成功,闻起来都是死磕的味道。”
成功的表象是光鲜的,但本质是汗水和煎熬。所谓“死磕”,就是在所有人都觉得“差不多行了”的时候,还在打磨;在所有人都选择放弃的时候,还在坚持。这种味道或许不好闻,但它是成功唯一的入场券。
一、引言:多维数据的可视化挑战
在前两篇文章中,我们分别构建了柱状图(直角坐标系,侧重数值对比)和饼图/环形图(极坐标系,侧重占比分布)。然而,实际业务中还存在两类特殊的可视化需求:
雷达图(Radar Chart / Spider Chart) 用于展示同一实体在多个维度上的综合能力。例如游戏角色的六维属性、企业员工的KPI考核指标、产品的多维度评分——这些场景的共同特点是"维度数量固定、各维度量纲一致",需要在同一坐标系中直观对比优劣。
散点图(Scatter Plot) 用于揭示两个连续变量之间的相关性。例如广告投入与销售额的关系、用户活跃度与留存率的关联、温度与能耗的耦合——散点图的核心价值在于发现数据分布规律、识别异常点、甚至预测趋势。
本文将同时挑战这两个组件的实现。它们的技术难点截然不同:雷达图需要在极坐标系中构建闭合多边形并支持多系列叠加;散点图则需要实现坐标映射、回归线拟合、以及气泡大小对第三维度的映射。通过统一的分层架构,我们将证明:即使面对完全不同的图形类型,良好的抽象设计仍能保证代码的复用性与可维护性。
二、雷达图:从极坐标到多边形的绘制艺术
2.1 核心难点分析
雷达图的本质是将N个维度的数值映射为极坐标系中的N个顶点,再连接成闭合多边形。这与饼图的扇区绘制有相似之处(都使用极坐标),但存在关键差异:
- 饼图:每个数据项对应一个扇区,扇区之间是"并列"关系,角度之和为360°;
- 雷达图:每个维度对应一个轴线,数据值映射为轴线上的"距离",多边形面积反映综合能力。
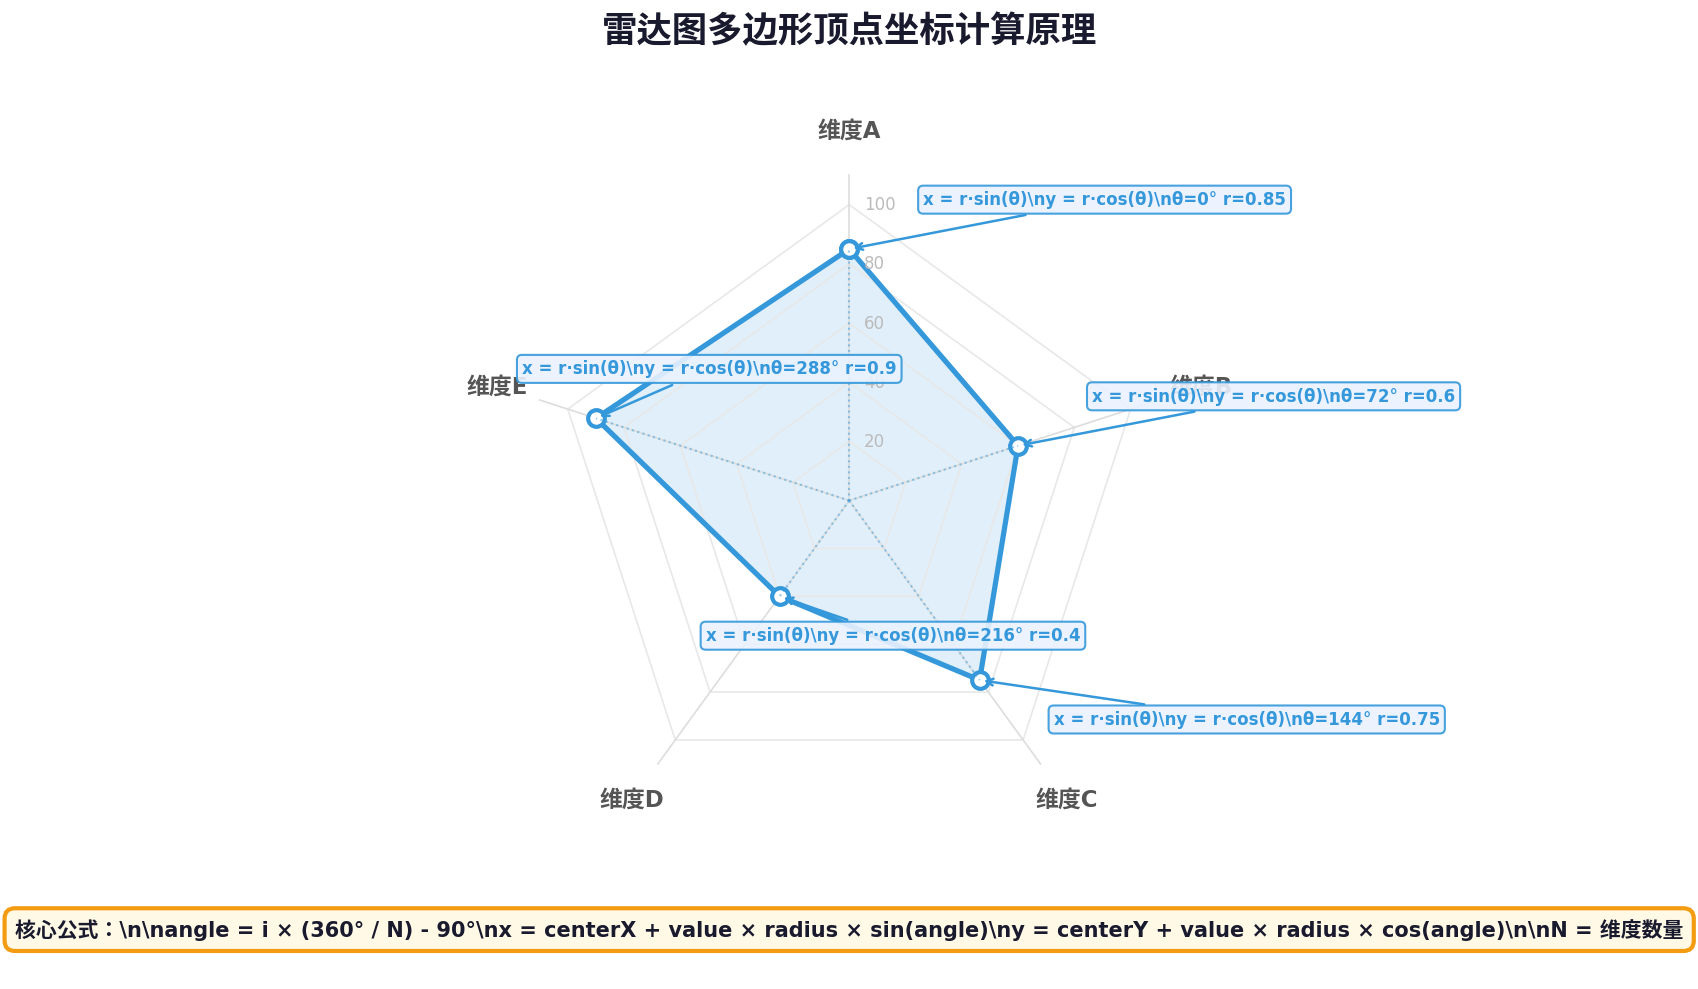
核心坐标转换公式:
// N = 维度数量,index = 当前维度索引(0到N-1)
// 每个维度均匀分布在360°圆周上
const anglePerDimension = 360 / N;

// 从12点钟方向开始,顺时针分布
const angleDeg = index * anglePerDimension - 90;
const angleRad = (angleDeg * Math.PI) / 180;

// 数据值(0~1标准化)映射为距离原点的长度
const distance = value * maxRadius;

// 极坐标转直角坐标
const x = centerX + distance * Math.sin(angleRad);
const y = centerY + distance * Math.cos(angleRad);
关键设计决策:
- 角度计算使用
sin/cos而非cos/sin,是因为Canvas坐标系中Y轴向下为正,需要通过三角函数相位调整确保0°位于12点钟方向; - 数据值必须先进行Min-Max标准化(映射到0~1区间),否则不同量纲的维度无法在同一雷达图中比较。
2.2 数据模型层
雷达图的数据模型需要处理多系列、多维度、以及数据标准化。
// model/RadarDataModel.ets
export class RadarDimension {
  name: string = '';     // 维度名称(如"攻击力")
  maxValue: number = 100; // 该维度的最大值(用于标准化)
}

export class RadarSeries {
  name: string = '';     // 系列名称(如"角色A")
  color: ResourceColor = '#3498db';
  values: number[] = []; // 各维度原始值,长度必须与dimensions一致
}

export class RadarDataModel {
  dimensions: RadarDimension[] = [];
  seriesList: RadarSeries[] = [];

  constructor(dims: RadarDimension[], series: RadarSeries[]) {
    this.dimensions = dims;
    this.seriesList = series;
    this.validate();
  }

  private validate(): void {
    const dimCount = this.dimensions.length;
    this.seriesList.forEach(s => {
      if (s.values.length !== dimCount) {
        console.error(`系列 ${s.name} 的数据长度与维度数量不匹配`);
      }
    });
  }

  // Min-Max标准化:将原始值映射到0~1区间
  getNormalizedValues(seriesIndex: number): number[] {
    const series = this.seriesList[seriesIndex];
    return series.values.map((val, idx) => {
      const max = this.dimensions[idx].maxValue;
      return max > 0 ? Math.min(val / max, 1.0) : 0;
    });
  }

  // 计算多边形顶点坐标
  getPolygonPoints(seriesIndex: number, centerX: number, centerY: number,
                   radius: number): Array<{ x: number; y: number }> {
    const normalized = this.getNormalizedValues(seriesIndex);
    const n = this.dimensions.length;
    const points: Array<{ x: number; y: number }> = [];

    for (let i = 0; i < n; i++) {
      const angleDeg = i * (360 / n) - 90;
      const angleRad = (angleDeg * Math.PI) / 180;
      const distance = normalized[i] * radius;
      points.push({
        x: centerX + distance * Math.sin(angleRad),
        y: centerY + distance * Math.cos(angleRad)
      });
    }

    return points;
  }
}
设计要点:
- 每个维度独立设置
maxValue,支持不同量纲的数据(如"攻击力"满值100,"防御力"满值200)在同一图中对比; getPolygonPoints()将数据计算与绘制分离,便于单元测试和复用。
2.3 雷达图绘制层
// painter/RadarChartPainter.ets
import { RadarDataModel, RadarSeries } from '../model/RadarDataModel';

export class RadarChartPainter {
  private ctx: CanvasRenderingContext2D;
  private width: number = 0;
  private height: number = 0;
  private centerX: number = 0;
  private centerY: number = 0;
  private radius: number = 0;

  // 配置
  private config = {
    gridLevels: 5,        // 网格层数
    axisColor: '#e0e0e0',
    gridColor: '#f0f0f0',
    labelColor: '#555',
    labelFont: '12px sans-serif'
  };

  constructor(context: CanvasRenderingContext2D) {
    this.ctx = context;
  }

  setSize(width: number, height: number): void {
    this.width = width;
    this.height = height;
    this.centerX = width / 2;
    this.centerY = height / 2;
    this.radius = Math.min(width, height) / 2 - 50; // 预留标签空间
  }

  draw(model: RadarDataModel, animationProgress: number = 1.0,
       selectedSeriesIndex: number = -1): void {
    this.ctx.clearRect(0, 0, this.width, this.height);

    this.drawGrid(model);
    this.drawAxes(model);
    this.drawLabels(model);

    // 绘制每个系列的多边形
    model.seriesList.forEach((series, index) => {
      const isSelected = index === selectedSeriesIndex;
      this.drawSeriesPolygon(model, index, animationProgress, isSelected);
    });
  }

  // 绘制网格(同心多边形)
  private drawGrid(model: RadarDataModel): void {
    const n = model.dimensions.length;
    const angles = Array.from({ length: n }, (_, i) =>
      (i * (360 / n) - 90) * Math.PI / 180
    );
    angles.push(angles[0]); // 闭合

    this.ctx.strokeStyle = this.config.gridColor;
    this.ctx.lineWidth = 1;

    for (let level = 1; level <= this.config.gridLevels; level++) {
      const r = (this.radius * level) / this.config.gridLevels;
      this.ctx.beginPath();
      angles.forEach((angle, idx) => {
        const x = this.centerX + r * Math.sin(angle);
        const y = this.centerY + r * Math.cos(angle);
        if (idx === 0) this.ctx.moveTo(x, y);
        else this.ctx.lineTo(x, y);
      });
      this.ctx.closePath();
      this.ctx.stroke();
    }
  }

  // 绘制轴线(从中心到各维度方向)
  private drawAxes(model: RadarDataModel): void {
    const n = model.dimensions.length;
    this.ctx.strokeStyle = this.config.axisColor;
    this.ctx.lineWidth = 1;

    for (let i = 0; i < n; i++) {
      const angleRad = (i * (360 / n) - 90) * Math.PI / 180;
      const x = this.centerX + this.radius * Math.sin(angleRad);
      const y = this.centerY + this.radius * Math.cos(angleRad);

      this.ctx.beginPath();
      this.ctx.moveTo(this.centerX, this.centerY);
      this.ctx.lineTo(x, y);
      this.ctx.stroke();
    }
  }

  // 绘制维度标签
  private drawLabels(model: RadarDataModel): void {
    const n = model.dimensions.length;
    this.ctx.font = this.config.labelFont;
    this.ctx.fillStyle = this.config.labelColor;
    this.ctx.textAlign = 'center';
    this.ctx.textBaseline = 'middle';

    for (let i = 0; i < n; i++) {
      const angleRad = (i * (360 / n) - 90) * Math.PI / 180;
      const labelRadius = this.radius + 25;
      const x = this.centerX + labelRadius * Math.sin(angleRad);
      const y = this.centerY + labelRadius * Math.cos(angleRad);
      this.ctx.fillText(model.dimensions[i].name, x, y);
    }
  }

  // 绘制单个系列的多边形
  private drawSeriesPolygon(model: RadarDataModel, seriesIndex: number,
                            progress: number, isSelected: boolean): void {
    const series = model.seriesList[seriesIndex];
    const points = model.getPolygonPoints(seriesIndex, this.centerX, this.centerY,
                                          this.radius * progress);

    if (points.length === 0) return;

    const color = series.color as string;

    // 构建路径
    this.ctx.beginPath();
    points.forEach((p, idx) => {
      if (idx === 0) this.ctx.moveTo(p.x, p.y);
      else this.ctx.lineTo(p.x, p.y);
    });
    this.ctx.closePath();

    // 填充(选中时增加不透明度)
    this.ctx.fillStyle = color;
    this.ctx.globalAlpha = isSelected ? 0.35 : 0.2;
    this.ctx.fill();
    this.ctx.globalAlpha = 1.0;

    // 描边
    this.ctx.strokeStyle = color;
    this.ctx.lineWidth = isSelected ? 3 : 2;
    this.ctx.stroke();

    // 绘制顶点
    points.forEach(p => {
      this.ctx.beginPath();
      this.ctx.arc(p.x, p.y, isSelected ? 5 : 4, 0, Math.PI * 2);
      this.ctx.fillStyle = '#ffffff';
      this.ctx.fill();
      this.ctx.strokeStyle = color;
      this.ctx.lineWidth = 2;
      this.ctx.stroke();
    });
  }

  // 点击检测:判断触摸点距离哪个系列的多边形最近
  hitTest(touchX: number, touchY: number, model: RadarDataModel): number {
    let closestIndex = -1;
    let minDistance = Infinity;

    model.seriesList.forEach((_, index) => {
      const points = model.getPolygonPoints(index, this.centerX, this.centerY, this.radius);

      // 计算点到多边形各边的最短距离
      for (let i = 0; i < points.length; i++) {
        const p1 = points[i];
        const p2 = points[(i + 1) % points.length];
        const dist = this.pointToLineDistance(touchX, touchY, p1.x, p1.y, p2.x, p2.y);
        if (dist < minDistance) {
          minDistance = dist;
          closestIndex = index;
        }
      }

      // 同时检查是否接近某个顶点(更直观的交互)
      points.forEach(p => {
        const vertexDist = Math.sqrt(Math.pow(touchX - p.x, 2) + Math.pow(touchY - p.y, 2));
        if (vertexDist < 20 && vertexDist < minDistance) {
          minDistance = vertexDist;
          closestIndex = index;
        }
      });
    });

    return minDistance < 40 ? closestIndex : -1;
  }

  // 点到线段的最短距离
  private pointToLineDistance(px: number, py: number, x1: number, y1: number,
                               x2: number, y2: number): number {
    const A = px - x1;
    const B = py - y1;
    const C = x2 - x1;
    const D = y2 - y1;
    const dot = A * C + B * D;
    const lenSq = C * C + D * D;
    let param = -1;
    if (lenSq !== 0) param = dot / lenSq;

    let xx: number, yy: number;
    if (param < 0) { xx = x1; yy = y1; }
    else if (param > 1) { xx = x2; yy = y2; }
    else { xx = x1 + param * C; yy = y1 + param * D; }

    return Math.sqrt(Math.pow(px - xx, 2) + Math.pow(py - yy, 2));
  }
}
技术亮点:
pointToLineDistance()实现了点到线段的精确距离计算(而非无限长直线),这是判断用户点击哪个系列的关键算法;- 多边形顶点使用"白底彩边"的圆点样式,在重叠的多系列场景中仍能清晰辨识;
- 选中系列通过增加描边宽度和填充不透明度实现视觉强调,无需复杂动画即可传达状态变化。
三、散点图:从坐标映射到回归分析
3.1 核心难点分析
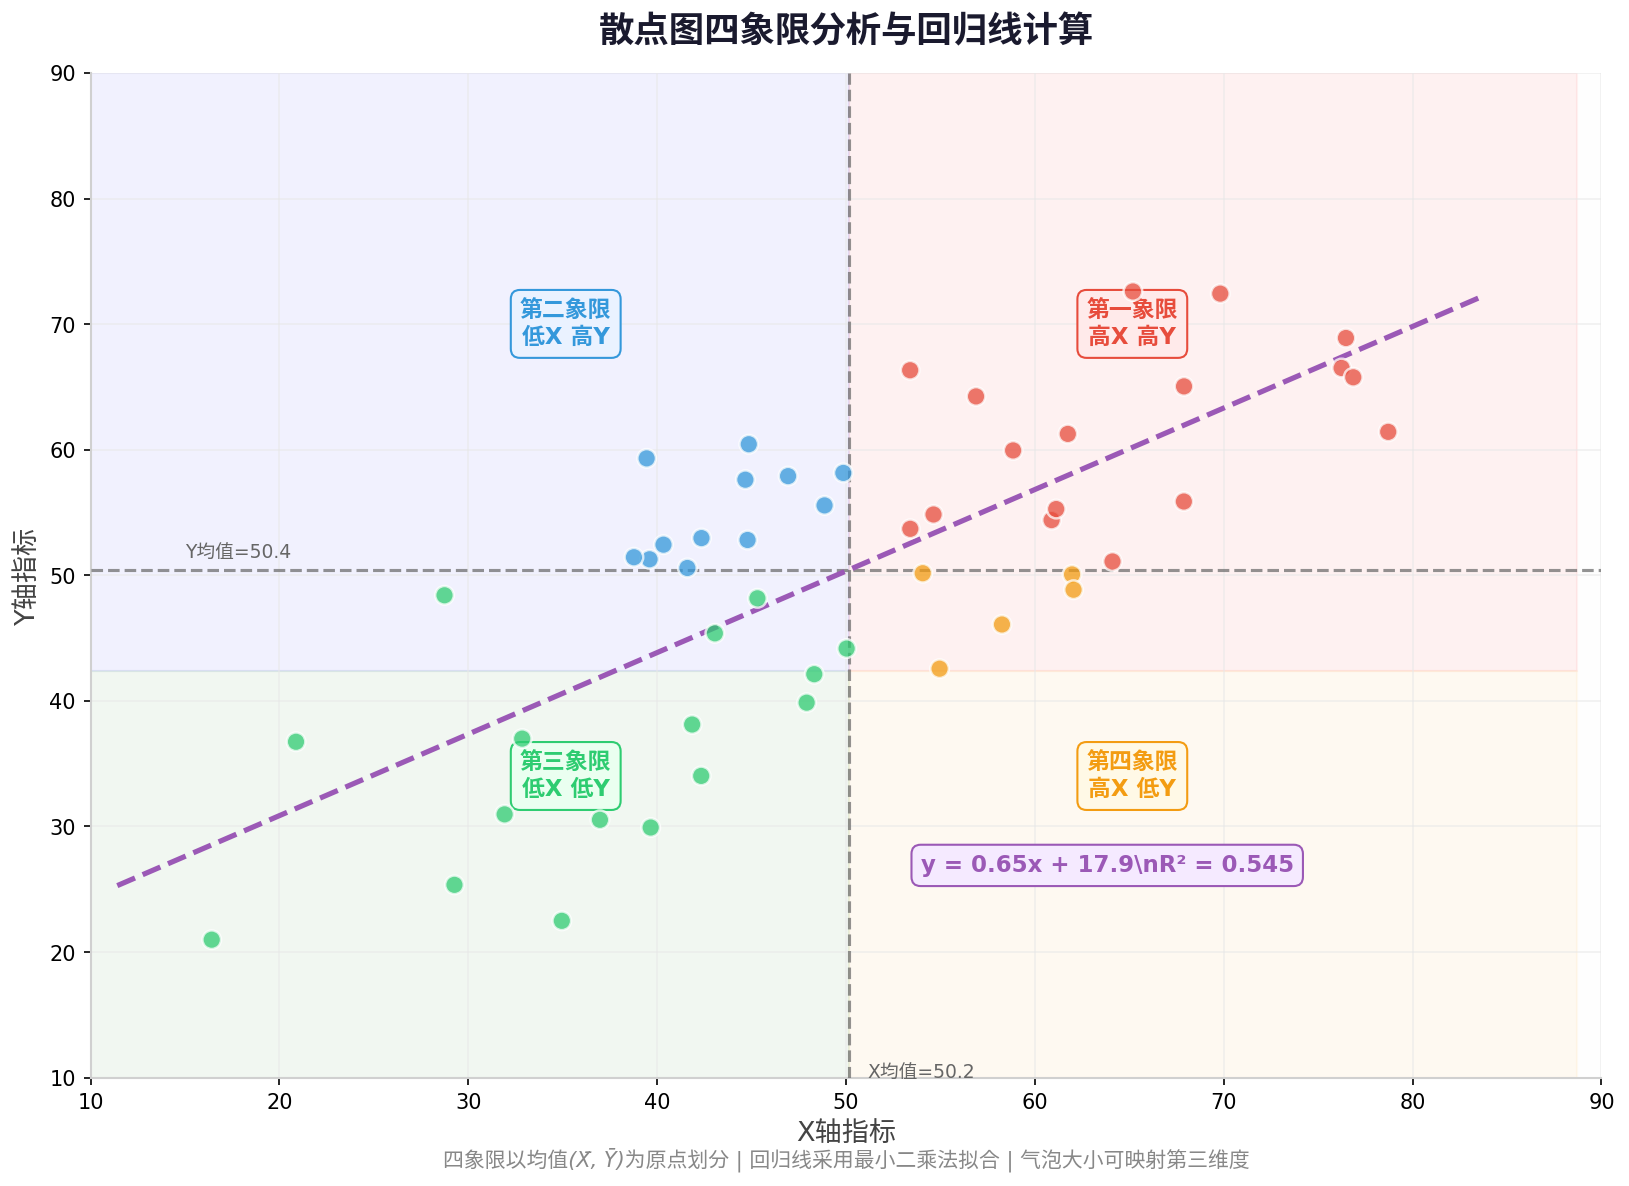
散点图看似简单——在直角坐标系中绘制一系列点——但生产级实现涉及多个技术挑战:
- 坐标映射:数据值域到像素坐标的线性变换,需处理负值、小数、以及自动计算合适的坐标轴范围;
- 回归线拟合:使用最小二乘法(Least Squares Method)计算趋势线,揭示变量间的线性关系;
- 气泡映射:将第三维度数据(如销售额、权重)映射为点的半径大小;
- 四象限分析:以均值点为原点划分四个象限,辅助业务决策。
3.2 数据模型层
// model/ScatterDataModel.ets
export class ScatterPoint {
  x: number = 0;           // X轴数值
  y: number = 0;           // Y轴数值
  size: number = 5;        // 气泡大小(第三维度)
  color: ResourceColor = '#3498db';  // 颜色(可映射第四维度分类)
  label: string = '';      // 数据标签
}

export class ScatterDataModel {
  points: ScatterPoint[] = [];

  // 自动计算的坐标轴范围
  xMin: number = 0;
  xMax: number = 0;
  yMin: number = 0;
  yMax: number = 0;

  constructor(points: ScatterPoint[]) {
    this.points = points;
    this.calculateRanges();
  }

  private calculateRanges(): void {
    if (this.points.length === 0) return;

    const xValues = this.points.map(p => p.x);
    const yValues = this.points.map(p => p.y);

    this.xMin = Math.min(...xValues);
    this.xMax = Math.max(...xValues);
    this.yMin = Math.min(...yValues);
    this.yMax = Math.max(...yValues);

    // 增加10%边距,避免点贴边
    const xPadding = (this.xMax - this.xMin) * 0.1;
    const yPadding = (this.yMax - this.yMin) * 0.1;
    this.xMin -= xPadding;
    this.xMax += xPadding;
    this.yMin -= yPadding;
    this.yMax += yPadding;

    // 确保最小范围不为0(避免除零)
    if (this.xMax === this.xMin) { this.xMin -= 1; this.xMax += 1; }
    if (this.yMax === this.yMin) { this.yMin -= 1; this.yMax += 1; }
  }

  // 最小二乘法线性回归:y = slope * x + intercept
  getRegressionLine(): { slope: number; intercept: number; r2: number } | null {
    if (this.points.length < 2) return null;

    const n = this.points.length;
    const sumX = this.points.reduce((s, p) => s + p.x, 0);
    const sumY = this.points.reduce((s, p) => s + p.y, 0);
    const sumXY = this.points.reduce((s, p) => s + p.x * p.y, 0);
    const sumX2 = this.points.reduce((s, p) => s + p.x * p.x, 0);
    const sumY2 = this.points.reduce((s, p) => s + p.y * p.y, 0);

    const slope = (n * sumXY - sumX * sumY) / (n * sumX2 - sumX * sumX);
    const intercept = (sumY - slope * sumX) / n;

    // 计算R²(决定系数)
    const yMean = sumY / n;
    const ssTotal = this.points.reduce((s, p) => s + Math.pow(p.y - yMean, 2), 0);
    const ssResidual = this.points.reduce((s, p) => {
      const predicted = slope * p.x + intercept;
      return s + Math.pow(p.y - predicted, 2);
    }, 0);
    const r2 = 1 - (ssResidual / ssTotal);

    return { slope, intercept, r2 };
  }

  // 数据值 → 像素坐标的映射
  mapToPixel(value: number, min: number, max: number, pixelMin: number,
             pixelMax: number): number {
    return pixelMin + ((value - min) / (max - min)) * (pixelMax - pixelMin);
  }
}
设计要点:
calculateRanges()自动计算坐标轴范围并增加10%边距,避免数据点紧贴边界;getRegressionLine()实现了完整的最小二乘法计算,包括斜率、截距和决定系数R²,R²越接近1表示线性相关性越强;- 所有数据映射通过统一的
mapToPixel()方法处理,确保X轴和Y轴的变换逻辑一致。
3.3 散点图绘制层
// painter/ScatterChartPainter.ets
import { ScatterDataModel, ScatterPoint } from '../model/ScatterDataModel';

export class ScatterChartPainter {
  private ctx: CanvasRenderingContext2D;
  private width: number = 0;
  private height: number = 0;

  // 绘制区域(扣除边距)
  private plotArea = { left: 50, right: 30, top: 30, bottom: 50 };
  private plotWidth: number = 0;
  private plotHeight: number = 0;

  constructor(context: CanvasRenderingContext2D) {
    this.ctx = context;
  }

  setSize(width: number, height: number): void {
    this.width = width;
    this.height = height;
    this.plotWidth = width - this.plotArea.left - this.plotArea.right;
    this.plotHeight = height - this.plotArea.top - this.plotArea.bottom;
  }

  draw(model: ScatterDataModel, animationProgress: number = 1.0,
       showRegression: boolean = true, showQuadrant: boolean = true,
       selectedIndex: number = -1): void {
    this.ctx.clearRect(0, 0, this.width, this.height);

    this.drawAxes(model);

    if (showQuadrant) {
      this.drawQuadrantLines(model);
    }

    if (showRegression) {
      this.drawRegressionLine(model);
    }

    this.drawPoints(model, animationProgress, selectedIndex);
    this.drawAxisLabels(model);
  }

  // 绘制坐标轴
  private drawAxes(model: ScatterDataModel): void {
    this.ctx.strokeStyle = '#ccc';
    this.ctx.lineWidth = 1.5;

    // X轴
    this.ctx.beginPath();
    this.ctx.moveTo(this.plotArea.left, this.plotArea.top + this.plotHeight);
    this.ctx.lineTo(this.plotArea.left + this.plotWidth, this.plotArea.top + this.plotHeight);
    this.ctx.stroke();

    // Y轴
    this.ctx.beginPath();
    this.ctx.moveTo(this.plotArea.left, this.plotArea.top);
    this.ctx.lineTo(this.plotArea.left, this.plotArea.top + this.plotHeight);
    this.ctx.stroke();
  }

  // 绘制四象限分割线(以均值点为界)
  private drawQuadrantLines(model: ScatterDataModel): void {
    const xMean = model.points.reduce((s, p) => s + p.x, 0) / model.points.length;
    const yMean = model.points.reduce((s, p) => s + p.y, 0) / model.points.length;

    const xPixel = model.mapToPixel(xMean, model.xMin, model.xMax,
                                     this.plotArea.left,
                                     this.plotArea.left + this.plotWidth);
    const yPixel = model.mapToPixel(yMean, model.yMin, model.yMax,
                                     this.plotArea.top + this.plotHeight,
                                     this.plotArea.top);

    this.ctx.strokeStyle = '#ddd';
    this.ctx.lineWidth = 1;
    this.ctx.setLineDash([5, 5]);

    // 垂直分割线
    this.ctx.beginPath();
    this.ctx.moveTo(xPixel, this.plotArea.top);
    this.ctx.lineTo(xPixel, this.plotArea.top + this.plotHeight);
    this.ctx.stroke();

    // 水平分割线
    this.ctx.beginPath();
    this.ctx.moveTo(this.plotArea.left, yPixel);
    this.ctx.lineTo(this.plotArea.left + this.plotWidth, yPixel);
    this.ctx.stroke();

    this.ctx.setLineDash([]);
  }

  // 绘制回归线
  private drawRegressionLine(model: ScatterDataModel): void {
    const reg = model.getRegressionLine();
    if (!reg) return;

    const x1 = model.xMin;
    const y1 = reg.slope * x1 + reg.intercept;
    const x2 = model.xMax;
    const y2 = reg.slope * x2 + reg.intercept;

    const px1 = model.mapToPixel(x1, model.xMin, model.xMax,
                                  this.plotArea.left,
                                  this.plotArea.left + this.plotWidth);
    const py1 = model.mapToPixel(y1, model.yMin, model.yMax,
                                  this.plotArea.top + this.plotHeight,
                                  this.plotArea.top);
    const px2 = model.mapToPixel(x2, model.xMin, model.xMax,
                                  this.plotArea.left,
                                  this.plotArea.left + this.plotWidth);
    const py2 = model.mapToPixel(y2, model.yMin, model.yMax,
                                  this.plotArea.top + this.plotHeight,
                                  this.plotArea.top);

    this.ctx.strokeStyle = '#9b59b6';
    this.ctx.lineWidth = 2.5;
    this.ctx.setLineDash([8, 4]);
    this.ctx.beginPath();
    this.ctx.moveTo(px1, py1);
    this.ctx.lineTo(px2, py2);
    this.ctx.stroke();
    this.ctx.setLineDash([]);

    // 标注回归方程
    this.ctx.fillStyle = '#9b59b6';
    this.ctx.font = 'bold 11px sans-serif';
    this.ctx.fillText(`y=${reg.slope.toFixed(2)}x+${reg.intercept.toFixed(1)} R²=${reg.r2.toFixed(3)}`,
                      this.plotArea.left + 10, this.plotArea.top + 15);
  }

  // 绘制散点(支持气泡大小映射)
  private drawPoints(model: ScatterDataModel, progress: number,
                     selectedIndex: number): void {
    model.points.forEach((point, index) => {
      const x = model.mapToPixel(point.x, model.xMin, model.xMax,
                                  this.plotArea.left,
                                  this.plotArea.left + this.plotWidth);
      const y = model.mapToPixel(point.y, model.yMin, model.yMax,
                                  this.plotArea.top + this.plotHeight,
                                  this.plotArea.top);

      // 动画:从中心点向外扩散出现
      const centerX = this.plotArea.left + this.plotWidth / 2;
      const centerY = this.plotArea.top + this.plotHeight / 2;
      const animX = centerX + (x - centerX) * progress;
      const animY = centerY + (y - centerY) * progress;

      const isSelected = index === selectedIndex;
      const radius = point.size * (isSelected ? 1.3 : 1.0) * progress;

      // 绘制气泡
      this.ctx.beginPath();
      this.ctx.arc(animX, animY, radius, 0, Math.PI * 2);
      this.ctx.fillStyle = point.color as string;
      this.ctx.globalAlpha = 0.7;
      this.ctx.fill();
      this.ctx.globalAlpha = 1.0;

      // 描边
      this.ctx.strokeStyle = isSelected ? '#1a1a2e' : '#ffffff';
      this.ctx.lineWidth = isSelected ? 3 : 1.5;
      this.ctx.stroke();

      // 选中时显示标签
      if (isSelected && point.label) {
        this.ctx.fillStyle = '#1a1a2e';
        this.ctx.font = 'bold 11px sans-serif';
        this.ctx.textAlign = 'center';
        this.ctx.fillText(point.label, animX, animY - radius - 8);
      }
    });
  }

  // 绘制坐标轴刻度标签
  private drawAxisLabels(model: ScatterDataModel): void {
    this.ctx.fillStyle = '#888';
    this.ctx.font = '10px sans-serif';
    this.ctx.textAlign = 'center';
    this.ctx.textBaseline = 'top';

    // X轴刻度(5档)
    for (let i = 0; i <= 4; i++) {
      const value = model.xMin + (model.xMax - model.xMin) * (i / 4);
      const x = model.mapToPixel(value, model.xMin, model.xMax,
                                  this.plotArea.left,
                                  this.plotArea.left + this.plotWidth);
      this.ctx.fillText(value.toFixed(0), x, this.plotArea.top + this.plotHeight + 8);
    }

    // Y轴刻度
    this.ctx.textAlign = 'right';
    this.ctx.textBaseline = 'middle';
    for (let i = 0; i <= 4; i++) {
      const value = model.yMin + (model.yMax - model.yMin) * (i / 4);
      const y = model.mapToPixel(value, model.yMin, model.yMax,
                                  this.plotArea.top + this.plotHeight,
                                  this.plotArea.top);
      this.ctx.fillText(value.toFixed(0), this.plotArea.left - 8, y);
    }
  }

  // 点击检测:找到距离触摸点最近的散点
  hitTest(touchX: number, touchY: number, model: ScatterDataModel): number {
    let closestIndex = -1;
    let minDistance = Infinity;

    model.points.forEach((point, index) => {
      const x = model.mapToPixel(point.x, model.xMin, model.xMax,
                                  this.plotArea.left,
                                  this.plotArea.left + this.plotWidth);
      const y = model.mapToPixel(point.y, model.yMin, model.yMax,
                                  this.plotArea.top + this.plotHeight,
                                  this.plotArea.top);
      const dist = Math.sqrt(Math.pow(touchX - x, 2) + Math.pow(touchY - y, 2));

      if (dist < minDistance && dist < point.size + 10) {
        minDistance = dist;
        closestIndex = index;
      }
    });

    return closestIndex;
  }
}
技术亮点:
- 散点入场动画采用"从中心向外扩散"的效果,而非简单的淡入,增强视觉层次感;
- 气泡大小通过
point.size直接映射为圆半径,支持第三维度数据的可视化; - 回归线使用虚线样式,与数据点形成视觉区分,同时标注R²值帮助用户判断拟合优度。
四、动画与交互设计
4.1 雷达图多边形展开动画
雷达图的入场动画是**多边形从中心向外"生长"**的过程——所有顶点同时从原点沿各自轴线延伸到目标位置。
// 在RadarChart组件中集成动画
startEntranceAnimation(): void {
  this.animator = animator.create({
    duration: 1000,
    easing: 'ease-out-cubic',
    fill: 'forwards',
    begin: 0,
    end: 100
  });

  this.animator.onFrame = (value: number) => {
    this.animationProgress = value / 100;
    // 使用cubic缓动:progress = 1 - (1-t)^3
    const eased = 1 - Math.pow(1 - this.animationProgress, 3);
    this.painter.draw(this.dataModel, eased, this.selectedSeriesIndex);
  };

  this.animator.play();
}
4.2 散点图渐入动画
散点图的动画策略与雷达图不同:由于散点之间无连接关系,采用从画布中心向外扩散的入场方式,营造"数据涌现"的视觉效果。
// 在ScatterChart组件中
startScatterAnimation(): void {
  this.animator = animator.create({
    duration: 1200,
    easing: 'ease-out',
    fill: 'forwards',
    begin: 0,
    end: 100
  });

  this.animator.onFrame = (value: number) => {
    this.animationProgress = value / 100;
    // 散点图使用线性缓动即可,因为每个点的运动轨迹独立
    this.painter.draw(this.dataModel, this.animationProgress,
                      this.showRegression, this.showQuadrant,
                      this.selectedIndex);
  };

  this.animator.play();
}
五、性能优化策略
5.1 雷达图优化
- 网格缓存:同心多边形网格在数据不变时完全静态,可预渲染到离屏Canvas;
- 顶点LOD:当维度数量超过12时,隐藏顶点圆点,仅保留多边形轮廓,避免视觉混乱;
- 系列裁剪:未选中的系列降低不透明度至0.1,而非完全隐藏,保持上下文感知。
5.2 散点图优化
- 大数据量降级:当点数超过500时,关闭气泡大小映射(统一使用固定半径),并将回归线计算移至Web Worker异步执行;
- 碰撞检测优化:使用空间哈希(Spatial Hash)或四叉树(QuadTree)加速点击检测,将O(n)复杂度降至O(log n);
- 局部重绘:选中某个散点时,仅重绘该点及其周围区域,而非整个画布。
六、完整使用示例
// pages/ChartDemo.ets
import { RadarChart } from '../components/chart/RadarChart';
import { ScatterChart } from '../components/chart/ScatterChart';
import { RadarDataModel, RadarDimension, RadarSeries } from '../components/chart/model/RadarDataModel';
import { ScatterDataModel, ScatterPoint } from '../components/chart/model/ScatterDataModel';

@Entry
@Component
struct ChartDemo {
  // 雷达图数据:游戏角色能力对比
  private radarData: RadarDataModel = new RadarDataModel(
    [
      { name: '攻击', maxValue: 100 },
      { name: '防御', maxValue: 100 },
      { name: '速度', maxValue: 100 },
      { name: '技巧', maxValue: 100 },
      { name: '耐力', maxValue: 100 },
      { name: '暴击', maxValue: 100 }
    ],
    [
      { name: '战士', color: '#FF6B6B', values: [90, 50, 80, 70, 40, 85] },
      { name: '坦克', color: '#45B7D1', values: [40, 90, 30, 50, 95, 20] },
      { name: '刺客', color: '#2ecc71', values: [60, 40, 95, 90, 30, 70] }
    ]
  );

  // 散点图数据:广告投入 vs 销售额(气泡大小=利润)
  private scatterData: ScatterDataModel = new ScatterDataModel([
    { x: 20, y: 35, size: 8, color: '#FF6B6B', label: 'Q1' },
    { x: 35, y: 55, size: 12, color: '#4ECDC4', label: 'Q2' },
    { x: 50, y: 48, size: 10, color: '#45B7D1', label: 'Q3' },
    { x: 65, y: 72, size: 15, color: '#96CEB4', label: 'Q4' },
    { x: 80, y: 68, size: 14, color: '#FFEAA7', label: 'Q5' },
    { x: 45, y: 60, size: 11, color: '#FF6B6B', label: 'Q6' },
    { x: 30, y: 42, size: 9, color: '#4ECDC4', label: 'Q7' },
    { x: 70, y: 80, size: 16, color: '#45B7D1', label: 'Q8' }
  ]);

  build() {
    Scroll() {
      Column({ space: 24 }) {
        Text('HarmonyOS 图表组件实战')
          .fontSize(22)
          .fontWeight(FontWeight.Bold)
          .fontColor('#1a1a2e')
          .margin({ top: 24 })

        // 雷达图区域
        Column() {
          Text('角色能力雷达对比')
            .fontSize(16)
            .fontWeight(FontWeight.Bold)
            .fontColor('#333')
            .margin({ bottom: 8 })

          RadarChart({ dataModel: this.radarData })
            .height(320)
        }
        .width('100%')
        .padding(16)
        .backgroundColor('#ffffff')
        .borderRadius(12)
        .margin({ left: 16, right: 16 })

        // 散点图区域
        Column() {
          Text('广告投入与销售额关联分析')
            .fontSize(16)
            .fontWeight(FontWeight.Bold)
            .fontColor('#333')
            .margin({ bottom: 8 })

          ScatterChart({
            dataModel: this.scatterData,
            showRegression: true,
            showQuadrant: true
          })
            .height(320)
        }
        .width('100%')
        .padding(16)
        .backgroundColor('#ffffff')
        .borderRadius(12)
        .margin({ left: 16, right: 16 })

        Text('点击图表元素查看交互效果')
          .fontSize(12)
          .fontColor('#999')
          .margin({ bottom: 30 })
      }
      .width('100%')
    }
    .backgroundColor('#f5f6fa')
  }
}
七、运行效果预览
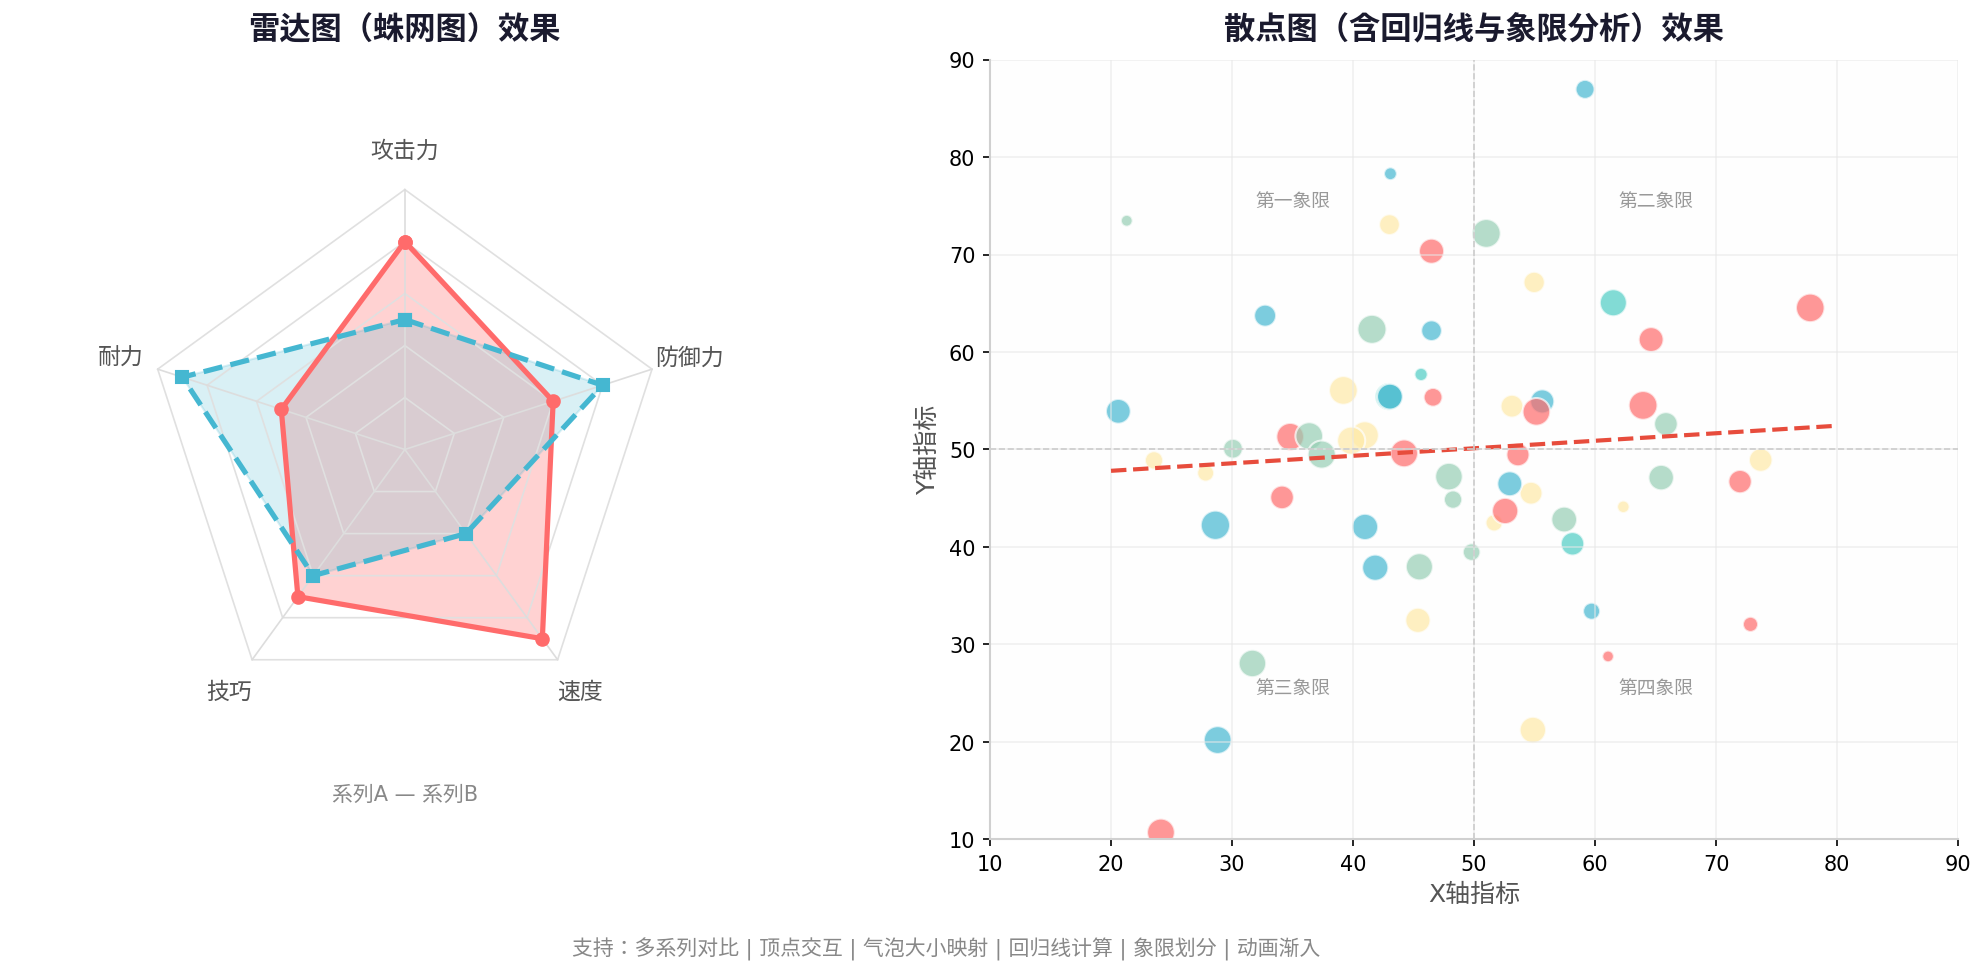
上图展示了两个组件的最终效果:
- 左侧雷达图:三个游戏角色的六维能力对比,多边形面积直观反映综合强度差异,顶点圆点便于精确定位;
- 右侧散点图:随机分布的数据点带有气泡大小差异,虚线回归线揭示X/Y变量的正相关趋势,四象限分割线辅助业务分析。
八、三种图表的技术对比总结
| 维度 | 柱状图(第120篇) | 饼图/环形图(第121篇) | 雷达图/散点图(本篇) |
|---|---|---|---|
| 坐标系 | 直角坐标系 | 极坐标系(扇区) | 雷达:极坐标;散点:直角坐标 |
| 核心图形 | 矩形柱体 | 圆弧扇区 | 雷达:闭合多边形;散点:圆点 |
| 数学难点 | 高度映射 | 角度分配、极坐标转换 | 雷达:多边形顶点计算;散点:回归线拟合 |
| 动画类型 | 高度增长 | 角度展开+半径扩展 | 雷达:多边形生长;散点:中心扩散 |
| 交互检测 | X轴区间 | 极坐标(距离+角度) | 雷达:点到线段距离;散点:圆点碰撞 |
| 适用数据 | 分类数值对比 | 占比分布 | 雷达:多维能力评估;散点:双变量相关性 |
| 扩展维度 | 分组/堆叠 | 多层环形 | 雷达:多系列叠加;散点:气泡大小映射 |
九、总结与扩展
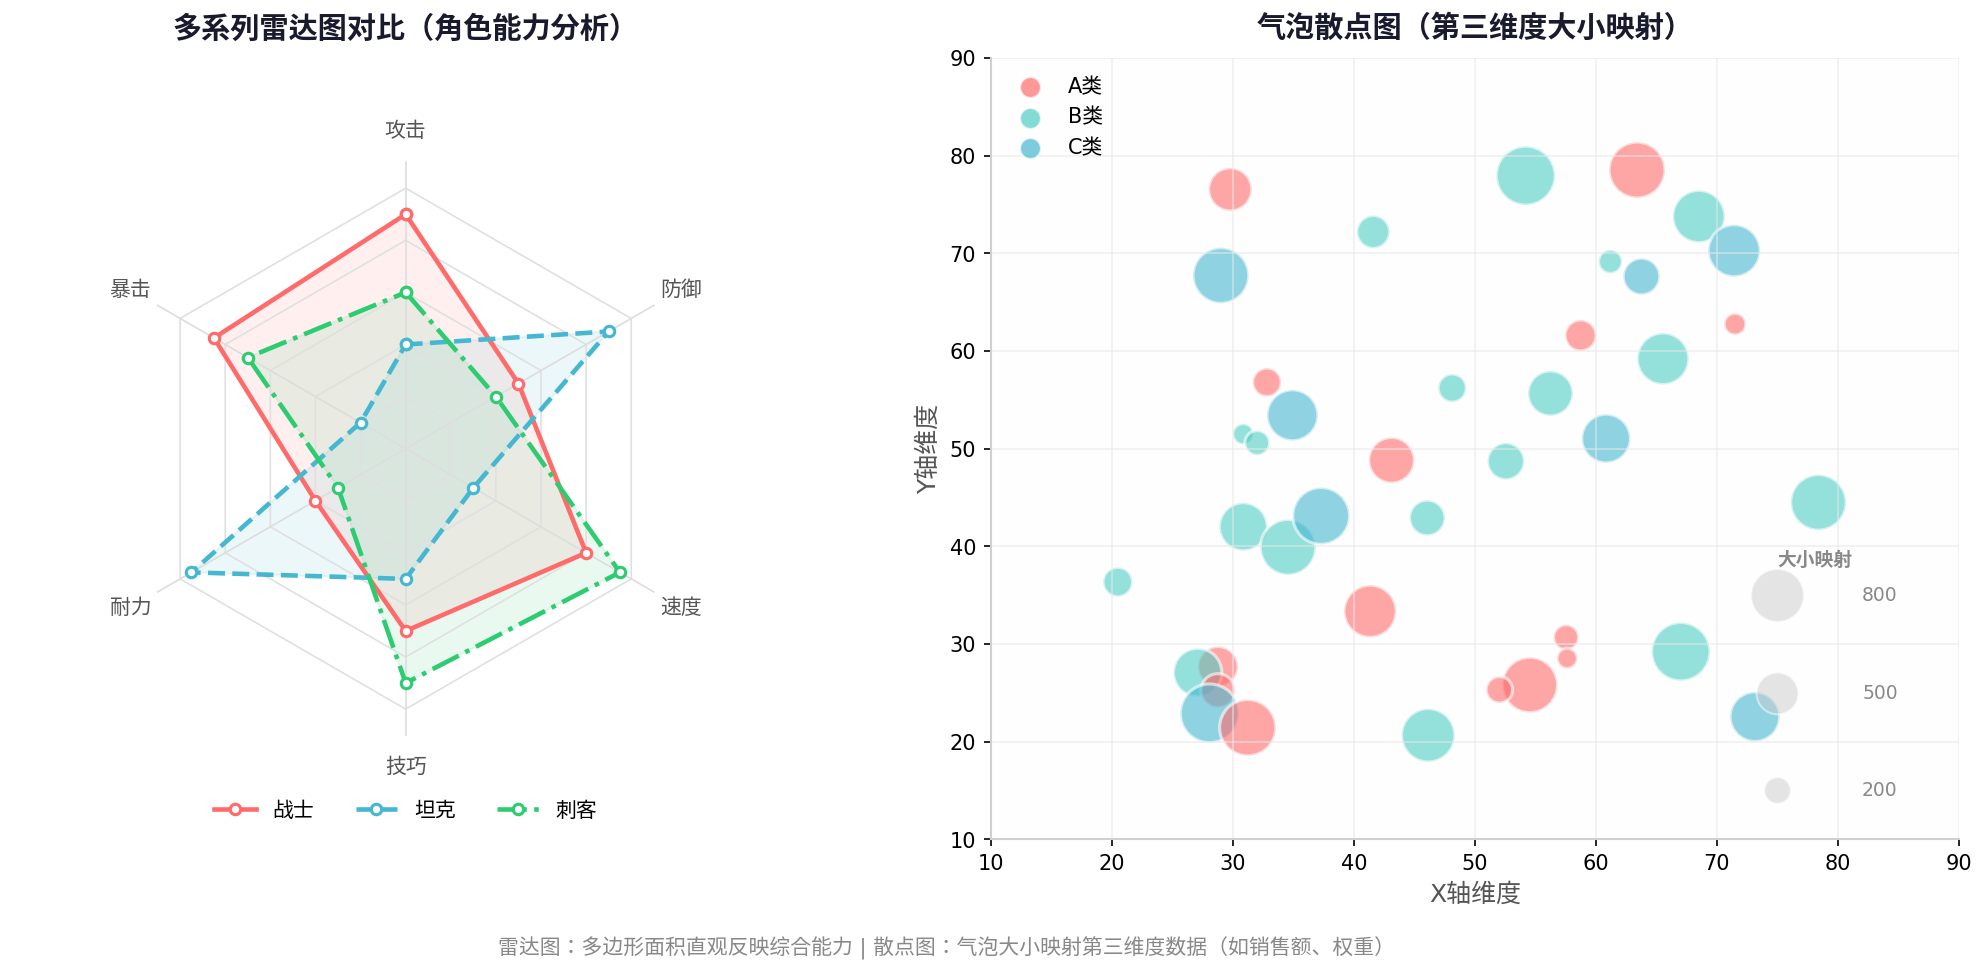
本文同时攻克了雷达图和散点图两个高复杂度组件,形成了完整的HarmonyOS图表组件 trilogy(柱状图→饼图→雷达/散点)。核心技术收获:
- 雷达图:掌握极坐标系下多边形顶点计算、同心网格绘制、以及点到线段的精确距离检测;
- 散点图:实现自动坐标范围计算、最小二乘法回归线拟合、四象限分析、以及气泡大小对第三维度的映射;
- 统一架构:三种图表共享相同的五层架构(数据/绘制/动画/交互/样式),证明了良好抽象设计的复用价值。
后续扩展方向:
- 折线图/面积图:基于直角坐标系,复用散点图的坐标映射逻辑,增加路径连接和填充;
- K线图(蜡烛图):金融数据专用,需要支持开盘价/收盘价/最高价/最低价的四元数据绘制;
- 热力图:二维矩阵数据的颜色映射,适用于用户行为分析、地理数据可视化;
- 图表联动:多个图表共享同一数据集,实现"点击柱状图月份→饼图更新该月品类占比→散点图显示该月广告数据"的联动分析。
转载自:https://blog.csdn.net/u014727709/article/details/163449756
欢迎 👍点赞✍评论⭐收藏,欢迎指正
讨论HarmonyOS开发技术,专注于API与组件、DevEco Studio、测试、元服务和应用上架分发等。
更多推荐


 1
1 0
0- 0


 已为社区贡献865条内容

所有评论(0)